
- Canadian homeowners spend 24% (or almost $300) more than renters on monthly shelter costs.
- Major Ontario cities boast the most expensive housing costs: Homeowners in 9 cities (including Toronto, Brampton and Markham) pay more than $2,000 a month.
- Oakville, Vaughan and Milton, ON, are the only cities where all residents (renters, as well as owners) spend more than $2,000 on shelter costs.
- Renters in 9 Québec cities (including Montréal and Québec City) pay less than $1,000 on housing costs; Trois-Rivières enjoys the cheapest housing costs for both homeowners ($956) and renters ($676).
- Renting and owning a home in Kelowna, BC, involves spending almost the same on housing, while owners in Brampton, ON, pay $676 more than renters;
- 79% of Canadian households spend less than 30% of their monthly income on housing costs. In Lévis and Saguenay, QC, about 88% do so;
- Renters who want to take on a mortgage to become homeowners in Canada need to spend almost 71% (or $857) more per month, but it’s cheaper to do so in metros like Winnipeg or Québec City;
2022 was a rollercoaster, no matter which side of the housing fence you found yourself on. As renters and owners got chewed by soaring inflation and the ongoing cost of living crisis, it made them rethink housing expenses and cut costs.
Beyond financial means, choosing whether to own or rent can be reduced to pros and cons: Renting means less responsibility, while owning is a long-term investment; Renting might mean freedom, while owning can bring stability. But, the reality is that we can’t bypass financial means, which often make the decision for us. To that end, one question remains the foundation of the rent versus own dilemma: How much can one afford in monthly housing costs?
Whether you rent or own, a monthly sum goes to utilities like electricity, heat, water and other municipal services. As per the latest Census, the key difference is that renters have monthly rent payments, whereas homeowners are responsible for property taxes, condominium fees and mortgage (where applicable). With that in mind, Point2 analyzed Canada’s 50 largest cities to determine how these cumulated housing costs affect the owners and renters living there. We also looked at the 10 largest metro areas to see what the monthly financial burden would be should a renter choose to become a homeowner with a mortgage.
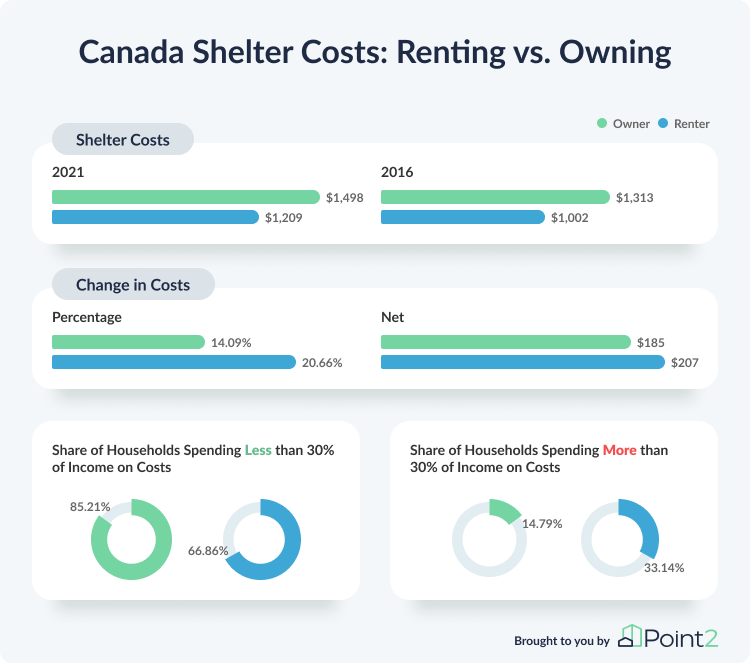
Nationwide, Homeowners Spend 24% More Than Renters on Housing Costs
Yet, more than 85% of owned households spend less than 30% of their income on monthly shelter costs compared to almost 67% of renter households
The number of owners (9,955,975) is almost double that of renters (4,953,840), making up more than 66% of Canada’s residents. However, the latest Census shows the country’s homeownership rate on the decline, with many Canadians putting ownership dreams on hold.
The gap is narrowing as renter households grew three times faster this past decade — proof that homeownership is becoming increasingly out of reach. Historically high prices and market volatility steer more and more Canadians away from owning their own homes, but monthly housing costs are also a contributing factor to renting gaining ground: On average, renters spend $289 less than owners on shelter expenses.
As per the most recent Census, the average shelter costs of a homeowner increased by 14% nationwide compared to five years prior, reaching $1,498. Although renter households experienced a larger bump of 20.66% , their average shelter costs reached $1,209.
In order to gauge whether the amount spent on monthly housing expenses is feasible, we considered 30% of a household’s income as a benchmark.
As it turns out, 79% of all Canadian dwellings spend less than 30% of income on shelter-related costs. That’s almost 11,613,000 households compared to 3,074,700 that spend 30% or more of their monthly income. This positive aspect is reflected in the cities discussed below, where the vast majority of households spend less than 30% of their income on housing expenses.
Cities in Ontario & British Columbia Post Most Expensive Housing Costs; Québec Cities Among Canada’s Cheapest
On a monthly basis, residents of Oakville, ON, pay three times as much as those of Trois-Rivières, QC
In the battle of shelter costs, Québec cities are in the more reasonable corner. With the 2021 census ranking BC and Ontario as the most expensive provinces (particularly given their high rent prices and share of households spending 30% or more of income on housing costs), it’s understandable that main cities in Ontario and British Columbia are on the less affordable end of the spectrum.
Among the cities analyzed, Trois-Rivières has the distinction of being the only one where both renters and owners deal with housing costs lower than $1,000 per month.

In fact, all of the Québec cities analyzed showcase lower shelter costs for renters than the $1,209 national average; Plus, with the exception of Montréal, the situation is similar when it comes to homeowner shelter costs too. Notably, as much as 89% of all households in Lévis, as well as 88% in Saguenay spend less than 30% of their income on housing.
On the other hand, Ontario and British Columbia city-dwellers deal with some of the most expensive housing costs in the country, dominating the top 15 highest shelter costs.
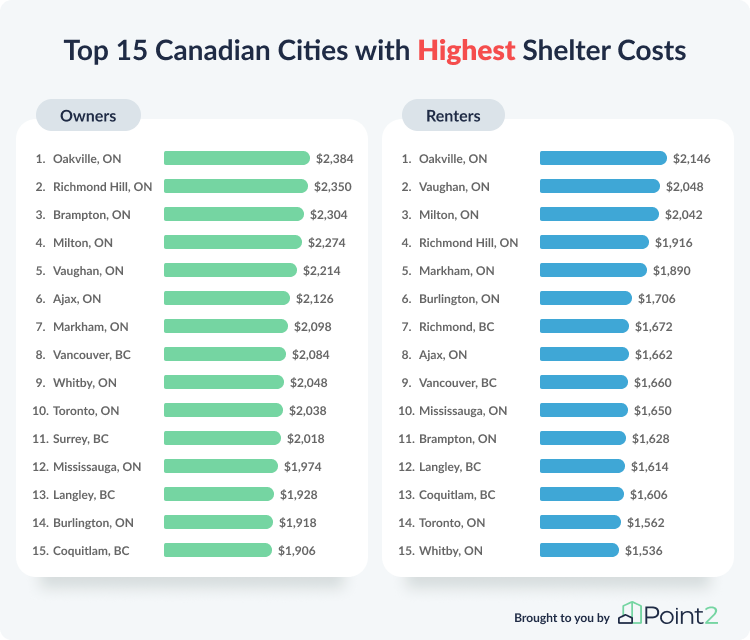
Specifically, Oakville, ON takes the cake for the most expensive shelter costs in Canada — both for homeowners ($2,384) and for renters ($2,146) — followed by cities like Richmond Hill, Milton, and Vaughan. While renting in Toronto averages $1,562 per month and owning reaches $2,038, residents in cities such as Markham, Brampton, and even Ajax pay even more for shelter costs, as per the most recent Census data. Despite having to deal with such high monthly costs, homeowners make up the majority in all of these cities, ranging from 78% in Oakville to 86% in Vaughan.
Even so, there are Ontario pockets — such as Windsor, St. Catharines or Greater Sudbury — where both renters and owners deal with more reasonable shelter costs.
Whether you rent or own in British Columbia cities, your monthly housing expenses exceed the national averages for both owners and renters: BC owner housing costs range between $1,614 in Kelowna to $2,084 in Vancouver, while renter costs go from $1,324 in Abbotsford to $1,672 in Richmond.
Differences of Less than 10% in Housing Costs Put Some Renters & Owners in the Same Boat
Owning or renting in Kelowna, Richmond & Kingston involves almost the same shelter costs
Housing costs are not remarkably different between homeowners and renters in some of Canada’s most populous cities. For example, homeownership in Kelowna, BC, comes with a $78 (or 5%) bump in housing costs compared to renting. Similarly, in Kingston, ON, it means $120 (9%) more, while in Richmond, BC it involves $122 (7%) more going to monthly shelter costs.
However, things skew in favor of renters the farther we go down the list of cities. In particular, homeowners in Brampton, ON spend $676 more than renters on housing costs, while those in Surrey, BC, deal with a $584 difference. Coincidentally, owners in Surrey and Brampton also experienced the sharpest five-year uptick in housing costs since the previous Census of 2016 — 25.5% and 23%, respectively.
In terms of percentage, Montréal homeowners draw the shorter end of the stick by paying 58% more (or $563) than what renters spend on shelter costs. Interestingly, renters make up 64% of Montréal residents, as opposed to 36% who are owners.
Going from Renter to Owner with Mortgage More Doable Depending on Metro of Residence
Renters who want to take on a mortgage in Winnipeg & Québec City metros would add less than $700 a month to their housing costs
For most homeowners, mortgage payments take up the bulk of the amount allotted to monthly shelter costs. In Canada, owners with a mortgage spend $2,066 on monthly housing costs — and way more than that in metros like Toronto ($2,852), Vancouver ($2,832), or Calgary ($2,344). (Check out the differences in housing costs between homeowners with and without mortgage in the top 10 metros in Canada). Still, the dream of homeownership remains alluring.
Granted, becoming a homebuyer in Canada is no easy feat in this time of straining financial health — especially for first-time buyers. Renters who think of becoming owners with mortgages must shed an extra $857 a month for housing costs. However, the amount varies, depending on the metro they live in.
For instance, if you plan on becoming an owner with mortgage, Toronto and Vancouver metros might not be your first choice because you’d pay at least $1,200 more than what renters spend here. However, making the ownership decision in Winnipeg or Québec City metros is easier — at least in theory — given the smaller differences of $628 and $671, respectively. The Ottawa-Gatineau metro is next in line in terms of smallest differences between shelter costs for renters and owners with a mortgage ($772) followed by the Kitchener-Cambridge-Waterloo area with $812.
Reports have documented the decline in homeownership rates and the subsequent rapid rise of renter households in Canada, with post-pandemic disruptions like supply cuts or growing immigration serving as catalysts for surging demand and skyrocketing prices. The exponential growth in number of renters is not unexpected given the increased mortgage rates, with some would-be owners choosing to wait out the market and push back personal goals. Only time will tell if they’ll have better chances in 2023.
Check out the table below for the main data points used in the study. Use the filters to rank the 50 largest Canadian cities based on the variable that interests you, be it average shelter costs, net or percentage difference between renter and owner shelter costs, the share of households spending more or less than 30% of income on shelter costs, and more.
| City | Average Owner Shelter Costs | Average Renter Shelter Costs | Net Difference between Owner & Renter Costs | % Difference between Owner & Renter Costs | Share of Households Spending <30% of income | Share of Households Spending >30% of income | Share of Owners spending <30% of income | Share of Owners spending >30% of income | Share of Renters spending <30% of income | Share of Renters spending >30% of income |
|---|---|---|---|---|---|---|---|---|---|---|
| Toronto, ON | $2,038 | $1,562 | $476 | 30.47% | 67.53% | 32.47% | 74.44% | 25.56% | 60.00% | 40.00% |
| Montréal, QC | $1,532 | $969 | $563 | 58.10% | 75.78% | 24.22% | 82.00% | 18.00% | 72.18% | 27.82% |
| Calgary, AB | $1,774 | $1,404 | $370 | 26.35% | 77.10% | 22.90% | 82.27% | 17.73% | 65.60% | 34.40% |
| Ottawa, ON | $1,668 | $1,422 | $246 | 17.30% | 79.86% | 20.14% | 88.28% | 11.72% | 64.86% | 35.14% |
| Edmonton, AB | $1,720 | $1,302 | $418 | 32.10% | 75.69% | 24.31% | 82.31% | 17.69% | 64.05% | 35.95% |
| Winnipeg, MB | $1,326 | $1,137 | $189 | 16.62% | 79.82% | 20.18% | 89.03% | 10.97% | 64.00% | 36.00% |
| Mississauga, ON | $1,974 | $1,650 | $324 | 19.64% | 71.96% | 28.04% | 76.55% | 23.45% | 60.92% | 39.08% |
| Vancouver, BC | $2,084 | $1,660 | $424 | 25.54% | 66.53% | 33.47% | 73.66% | 26.34% | 60.57% | 39.43% |
| Brampton, ON | $2,304 | $1,628 | $676 | 41.52% | 69.02% | 30.98% | 70.70% | 29.30% | 63.03% | 36.97% |
| Hamilton, ON | $1,606 | $1,233 | $373 | 30.25% | 76.80% | 23.20% | 84.21% | 15.79% | 62.51% | 37.49% |
| Surrey, BC | $2,018 | $1,434 | $584 | 40.73% | 73.93% | 26.07% | 76.03% | 23.97% | 69.12% | 30.88% |
| Québec City, QC | $1,195 | $904 | $291 | 32.19% | 83.89% | 16.11% | 91.59% | 8.41% | 75.75% | 24.25% |
| Halifax, NS | $1,386 | $1,251 | $135 | 10.79% | 78.17% | 21.83% | 89.16% | 10.84% | 63.29% | 36.71% |
| Laval, QC | $1,374 | $1,003 | $371 | 36.99% | 82.66% | 17.34% | 88.11% | 11.89% | 71.79% | 28.21% |
| London, ON | $1,424 | $1,213 | $211 | 17.39% | 75.79% | 24.21% | 86.32% | 13.68% | 61.05% | 38.95% |
| Markham, ON | $2,098 | $1,890 | $208 | 11.01% | 67.21% | 32.79% | 70.52% | 29.48% | 52.22% | 47.78% |
| Vaughan, ON | $2,214 | $2,048 | $166 | 8.11% | 72.10% | 27.90% | 75.75% | 24.25% | 49.62% | 50.38% |
| Gatineau, QC | $1,286 | $968 | $318 | 32.85% | 84.23% | 15.77% | 90.91% | 9.09% | 74.10% | 25.90% |
| Saskatoon, SK | $1,528 | $1,210 | $318 | 26.28% | 77.87% | 22.13% | 85.89% | 14.11% | 62.92% | 37.08% |
| Kitchener, ON | $1,608 | $1,334 | $274 | 20.54% | 76.68% | 23.32% | 85.23% | 14.77% | 63.96% | 36.04% |
| Longueuil, QC | $1,261 | $907 | $354 | 39.03% | 82.69% | 17.31% | 89.53% | 10.47% | 75.15% | 24.85% |
| Burnaby, BC | $1,744 | $1,536 | $208 | 13.54% | 69.04% | 30.96% | 74.08% | 25.92% | 61.28% | 38.72% |
| Windsor, ON | $1,169 | $1,046 | $123 | 11.76% | 78.87% | 21.13% | 87.39% | 12.61% | 64.55% | 35.45% |
| Regina, SK | $1,462 | $1,214 | $248 | 20.43% | 80.69% | 19.31% | 88.82% | 11.18% | 64.45% | 35.55% |
| Oakville, ON | $2,384 | $2,146 | $238 | 11.09% | 73.60% | 26.40% | 79.16% | 20.84% | 54.18% | 45.82% |
| Richmond, BC | $1,794 | $1,672 | $122 | 7.30% | 65.13% | 34.87% | 68.98% | 31.02% | 55.54% | 44.46% |
| Richmond Hill, ON | $2,350 | $1,916 | $434 | 22.65% | 62.90% | 37.10% | 66.79% | 33.21% | 48.84% | 51.16% |
| Burlington, ON | $1,918 | $1,706 | $212 | 12.43% | 76.88% | 23.12% | 84.08% | 15.92% | 55.11% | 44.89% |
| Oshawa, ON | $1,726 | $1,400 | $326 | 23.29% | 72.37% | 27.63% | 80.74% | 19.26% | 57.34% | 42.66% |
| Sherbrooke, QC | $1,096 | $760 | $336 | 44.21% | 83.55% | 16.45% | 91.90% | 8.10% | 75.32% | 24.68% |
| Greater Sudbury, ON | $1,362 | $1,037 | $325 | 31.34% | 82.78% | 17.22% | 90.63% | 9.37% | 68.45% | 31.55% |
| Abbotsford, BC | $1,696 | $1,324 | $372 | 28.10% | 76.46% | 23.54% | 80.99% | 19.01% | 66.62% | 33.38% |
| Lévis, QC | $1,148 | $892 | $256 | 28.70% | 88.95% | 11.05% | 93.77% | 6.23% | 79.62% | 20.38% |
| Coquitlam, BC | $1,906 | $1,606 | $300 | 18.68% | 70.86% | 29.14% | 75.69% | 24.31% | 59.89% | 40.11% |
| Barrie, ON | $1,752 | $1,526 | $226 | 14.81% | 73.24% | 26.76% | 80.74% | 19.26% | 57.46% | 42.54% |
| Saguenay, QC | $1,054 | $689 | $365 | 52.98% | 87.78% | 12.22% | 92.84% | 7.16% | 79.56% | 20.44% |
| Kelowna, BC | $1,614 | $1,536 | $78 | 5.08% | 72.67% | 27.33% | 81.88% | 18.12% | 55.80% | 44.20% |
| Guelph, ON | $1,678 | $1,380 | $298 | 21.59% | 77.08% | 22.92% | 84.40% | 15.60% | 63.00% | 37.00% |
| Trois-Rivières, QC | $956 | $676 | $280 | 41.42% | 86.83% | 13.17% | 93.27% | 6.73% | 79.09% | 20.91% |
| Whitby, ON | $2,048 | $1,536 | $512 | 33.33% | 78.66% | 21.34% | 82.63% | 17.37% | 60.47% | 39.53% |
| Cambridge, ON | $1,636 | $1,310 | $326 | 24.89% | 78.81% | 21.19% | 85.16% | 14.84% | 64.71% | 35.29% |
| St. Catharines, ON | $1,306 | $1,168 | $138 | 11.82% | 76.17% | 23.83% | 85.63% | 14.37% | 58.97% | 41.03% |
| Milton, ON | $2,274 | $2,042 | $232 | 11.36% | 74.69% | 25.31% | 78.09% | 21.91% | 58.41% | 41.59% |
| Langley, BC | $1,928 | $1,614 | $314 | 19.45% | 78.05% | 21.95% | 81.03% | 18.97% | 64.72% | 35.28% |
| Kingston, ON | $1,438 | $1,318 | $120 | 9.10% | 74.96% | 25.04% | 88.35% | 11.65% | 57.96% | 42.04% |
| Ajax, ON | $2,126 | $1,662 | $464 | 27.92% | 75.31% | 24.69% | 77.90% | 22.10% | 62.17% | 37.83% |
| Waterloo, ON | $1,606 | $1,440 | $166 | 11.53% | 75.95% | 24.05% | 86.43% | 13.57% | 59.07% | 40.93% |
| Terrebonne, QC | $1,400 | $991 | $409 | 41.27% | 86.54% | 13.46% | 90.71% | 9.29% | 73.19% | 26.81% |
| Saanich, BC | $1,678 | $1,520 | $158 | 10.39% | 76.46% | 23.54% | 83.40% | 16.60% | 60.87% | 39.13% |
| St. John's, NL | $1,414 | $988 | $426 | 43.12% | 78.05% | 21.95% | 86.07% | 13.93% | 65.61% | 34.39% |
Methodology
- For this study, we took into consideration the 50 largest Census Subdivisions (Cities) and the 10 largest Census Metropolitan Areas, based on the most recent population data from Statistics Canada 2021 Census of Population.
- As per Statistics Canada 2021 Census, owner housing costs include, where applicable, mortgage payments, property taxes, and condominium fees, along with the costs of electricity, heat, water, and other municipal services, while renter housing costs include, where applicable, the rent and the costs of electricity, heat, water, and other municipal services.
- Statistics Canada 2021 Census defines the Shelter-cost-to-income ratio as the proportion of the average total income of a household that is spent on shelter costs and is calculated for private households that reported a total household income greater than zero.
Fair use and redistribution
We encourage and freely grant permission to reuse, host or repost this article. When doing so, we only ask that you kindly attribute the authors by linking to Point2Homes.com or this page, so that your readers can learn more about this project, the research behind it and its methodology.