
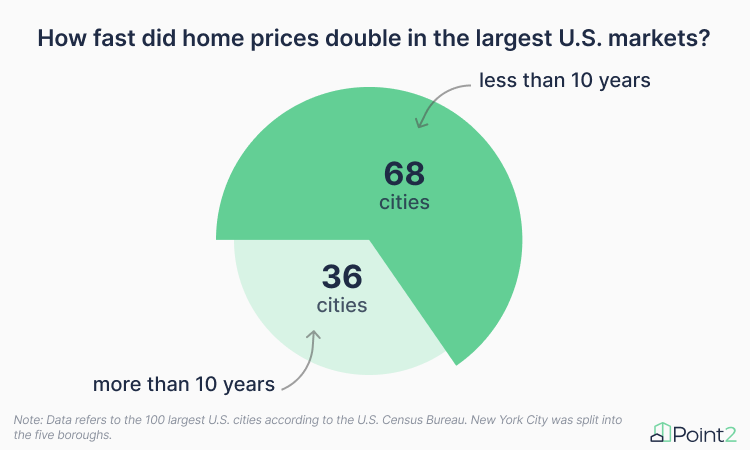
- Prices have doubled in less than 10 years in 68 of the country’s largest 100 cities. To rub salt in the housing wound, even as recently as 2019, Detroit homes were half of what they cost now.
- Home prices in sunny Miami and Tampa, FL, have doubled since 2018, as they have in Baltimore, MD, and Spokane, WA, potentially in light of investor interest and urban revitalization efforts.
- Buyers in Irvine, CA, have been holding onto their seats (and wallets) as home prices doubled from an already steep $750,000 to $1.5 million within the last 7 years.
- But price appreciation took its time in Anchorage, AK. Geographical constraints and a dwindling population have caused it to take as long as 21 years for home prices to double and reach today’s $359,000.
The national median home price has yo-yoed towards twice what it was ten years ago. The average home in the United States went from around $200k to $400k, molded by an unrelenting storm of inflation, tight supply, and surging demand. With that in mind, let’s gather around the fire and reminisce about an enchanted era when homes used to cost half what they do now. That magical time was… not even a decade ago.
Back then, demand had not yet intensified by a world-altering global pandemic, and the national home price hadn’t geared up for historical hikes. Generational housing dichotomy also wasn’t making headlines, and Millennials were just fresh-faced homebuyers anticipating a reasonably priced starter home. But, much like Millennials’ homeownership plans, a lot has changed since then.
Fluctuating mortgage rates, steep property prices, or supply deficits are no new challenges. But they have never unleashed such a rapid-fire onslaught on homebuyers in the U.S. as they have in today’s housing market.
So, with 20/20 hindsight and a shared regret for not buying years ago, we set to answer one simple question: Did prices really double so fast? To find out, Point2Homes analysts looked at historical data to calculate how many years it took for home prices in the 100 largest U.S. cities to double and hit today’s market rates.
Florida & Arizona Claim Most Markets With Rapidly Rising Rates
Homes doubled in price in Miami, FL, Tampa, FL, Spokane, WA, Baltimore, MD, & Detroit, MI since 2018-2019,
A common home appreciation theory is that residential properties tend to double in value in about 10 years. But this good news for investors spells bad news for buyers, considering that most of the country’s major cities had home prices double even faster than that.
For example, homebuying in Detroit, MI, used to be twice as feasible: At the start of 2019, you could buy a home in Detroit for $40,000 — yes, really. Similarly, data shows that prices also doubled quickly in Spokane, WA, where not that long ago, in March 2018, a home cost just $184,500 as compared to $371,000 nowadays.
Across the country, home prices accelerated just as dramatically in Miami, as well as in Tampa, FL (a city building momentum for a while now): The past six years were enough for homes to double in cost and reach about half a million dollars in both cities. In fact, prices in all five of the largest markets in the state — including Jacksonville, Orlando, and St. Petersburg — have doubled in just six to eight years.
Arizona is in a similar position, with seven big cities doubling in price in just six to seven years. Here, prices increased twofold in booming Scottsdale, where the average home costs a whopping $837,500 compared to $416,000 at the end of 2017. Phoenix even made headlines about its surge in home prices — and local incomes can barely keep up. Some attribute this to the state taking inspiration from neighboring California, whereas others blame it on supply-and-demand math gone wrong.
Speaking of California, as home to a University of California campus, multiple tech companies, and financial institutions, Irvine’s story of doubling price tags writes itself. Here, home prices ballooned to $1.5 million versus $750,000 back in 2017, making Irvine the most expensive big market in the U.S.
High-end Fremont is in a similar position: Cranked up by its proximity to Silicon Valley and the presence of big players like Tesla and Facebook, homes in Fremont went from $740k in late 2015 to double that ($1.5M) as of February this year. And reality is that overall desirability and high-paying jobs in these areas will only continue to drive up demand and prices.
Delayed Doubling in 9 Major Cities Takes Around 2 Decades to Hit Twice the Price
Virginia trio joins Anchorage, AK & Urban Honolulu, HI in the slow price appreciation club
Despite last year’s slight decline in home prices, homebuying costs weigh heavily on the minds of potential homebuyers. What’s encouraging is that there is no one-speed-fits-all, as home prices pick up sooner in some places than others. Meanwhile, not even the post-pandemic rapid rise in home prices sped up matters in some major cities.
Home prices accelerated least dramatically in Anchorage, AK, which took more than 21 years to go from $179,600 (in 2003) to $359,200 now. Likewise, it took more than 19 years for homes to double in cost in seven other major cities: Urban Honolulu, HI, Washington, D.C., Corpus Christi, TX, Virginia’s Arlington, Chesapeake, and Virginia Beach, as well as Brooklyn, NYC.
Various factors can contribute to the slowing pace of price appreciation. These can range from scarce new housing developments in Honolulu, to Alaska just being Alaska, making Anchorage a less active housing market. Or, from Brooklyn having exorbitant home prices to begin with, to concerns about sea-level rise in Chesapeake, VA.
Washington, D.C., and nearby Arlington both attract long-term investors interested in economic stability. Most are brought about by government-related employment. So, with a significant chunk of the population represented by transient professionals, students, and government employees, both cities are robust rental markets. This demand for rental housing may then provide stability to the overall housing market and reduce extreme volatility when it comes to homebuying.
Single-Family Home Median Prices Soared Across the Board
In half the largest cities, single-family home prices doubled faster than the overall residential market
Median home prices may have doubled at a neck-breaking pace, but historical data reveals that, in some cities, single-family dwellings doubled way faster than the overall housing market. To put things into a bleak perspective, single-family homes in Tampa, FL, are now twice as expensive as they were in 2019. Similarly, as recently as 2020, single-family homes in Detroit were half of today’s prices.
In 45 of the country’s 100 major cities, the median price for single-family dwellings has doubled faster than that of all residential property types combined.
One of the main reasons behind single-family homes picking up pace much faster than other types of housing is, of course, the pandemic. The dropping number of new single-family homes compared to multifamily, the urban-flight trend, and cheaper loans led to a shift in housing needs and preferences. In turn, this brought about a surge in a “might-as-well” mindset among prospective homebuyers as more began to prioritize space and greenery.
The cost of a single-family home doubled much faster in Philadelphia: The average Philly home took the last 19 years or so to double in price, but it took eight fewer years for single-family dwellings to go for twice the price and reach today’s $201,000. Similarly, single-family homes in Brooklyn doubled in the last 12 years, as opposed to the 19 years it took the average residential property.
With interest rates slated to decrease throughout 2024, more potential buyers may be able to afford homes, leading to an even greater increase in the housing market’s demand. But if there’s one thing we’ve learned from recent (unprecedented) times, it’s that accurate pricing forecasts are getting tougher and tougher to make.
Methodology
Point2Homes, a division of Yardi Systems Inc., covers real estate trends and news. Point2Homes studies are based on internal data, public records, governmental sources, online research and other reliable third-party agencies.
- For this study, we considered the 100 largest U.S. cities, according to the most recent population data from the U.S. Census Bureau. New York City was split into five boroughs.
- The study uses data as far back as January 2000 to determine when homes were sold for half the median price they do as of February 2024.
- Sources for historical price data include Redfin, Zillow, Realtor, PropertyShark, and local MLSs.
- In the few cases where home prices did not double in this timeframe (January 2000 to February 2024), we selected the lowest price point within this period.
- Manhattan was excluded from single-family home price calculations due to extreme historic price fluctuations caused by few transactions.
Fair use and redistribution
We encourage and freely grant permission to reuse, host or repost this article. When doing so, we only ask that you kindly attribute the authors by linking to Point2Homes.com or this page, so that your readers can learn more about this project, the research behind it and its methodology.