
Residential Construction Trends
State- and Metro-Level Historical Data Point to Slowdown in Home Building
Number of Completed Units in 2023:
0
+4.2% Y-o-Y
Number of Started Units in 2023:
0
-9% Y-o-Y
Number of Permits Issued in 2023:
0
-11% Y-o-Y
While the small increase in the number of new homes hitting the market in 2023 could seem encouraging, it’s still underwhelming given the current housing shortage and increasing demand. Last year, 1,450,000 new homes were made available for buyers and renters in the U.S. This number is still below the 1.5 million homes per year that was the norm in the 2000s.
The undersupply of new homes is made worse by the decrease in starts and permits. Last year, developers broke ground on 1,420,000 new homes, which is a 9% drop compared to 2022. Permits are following the same downward path: For the second year in a row, the number of authorizations for new homes is falling. What follows is an overview of permits and new construction data, as well as employment, income and business data at the national level, but also at state and metro level, including all 384 existing U.S. metros.
Here are a few highlights:
- The total number of completed homes went up last year due to the 22% increase in multifamily units, which compensated for the 2% decrease in new single family homes.
- In 2023, permits fell for the second year in a row: Last year’s 11% drop followed the 5% drop from 2021.
- Like permits, total started units fell in 2023, by 9%. Similar to the negative trend in permitting activity, 2023 was the second year when builders broke ground on fewer homes compared to the previous year.
- The South took the lead with the most permits issued (821,600), followed by states in the West (344,500), the Midwest (190,200) and the Northeast (114,300).
- The top three states hoping to build the most in the near future are Texas, Florida and California, all boasting numbers of permits higher than 100,000 and even more than 200,000.
- On the other hand, in 18 states, less than 10,000 permits were issued per state, with Alaska authorizing less than 1,000 new homes.
- Of the 384 total U.S. metros, permits fell in 266 and increased or stagnated in 118.
Jump to a specific section:
By 2021, the number of residential permits issued at the national level more than doubled compared to 2012, but it decreased slightly in 2022 and 2023.
The drop in total permits recorded in both 2022 and 2023 is almost entirely due to the decrease in permits for single family homes.
Although the number of homes under construction and permits fell in 2023, the number of completed units kept steadily increasing.
2013 and 2021 recorded the biggest jumps in the total number of permits.
In 2014, the total number of permits issued at the national level crossed the 1-million mark and kept increasing until 2022, when the first drop was recorded.
With minor fluctuations, the average square footage of completed and started single family homes increased until 2015, when it started decreasing.
Due to the pandemic, single family home starts in 2021 saw their average square footage go up, from 2,473 to 2,532, only to start falling again the following year.
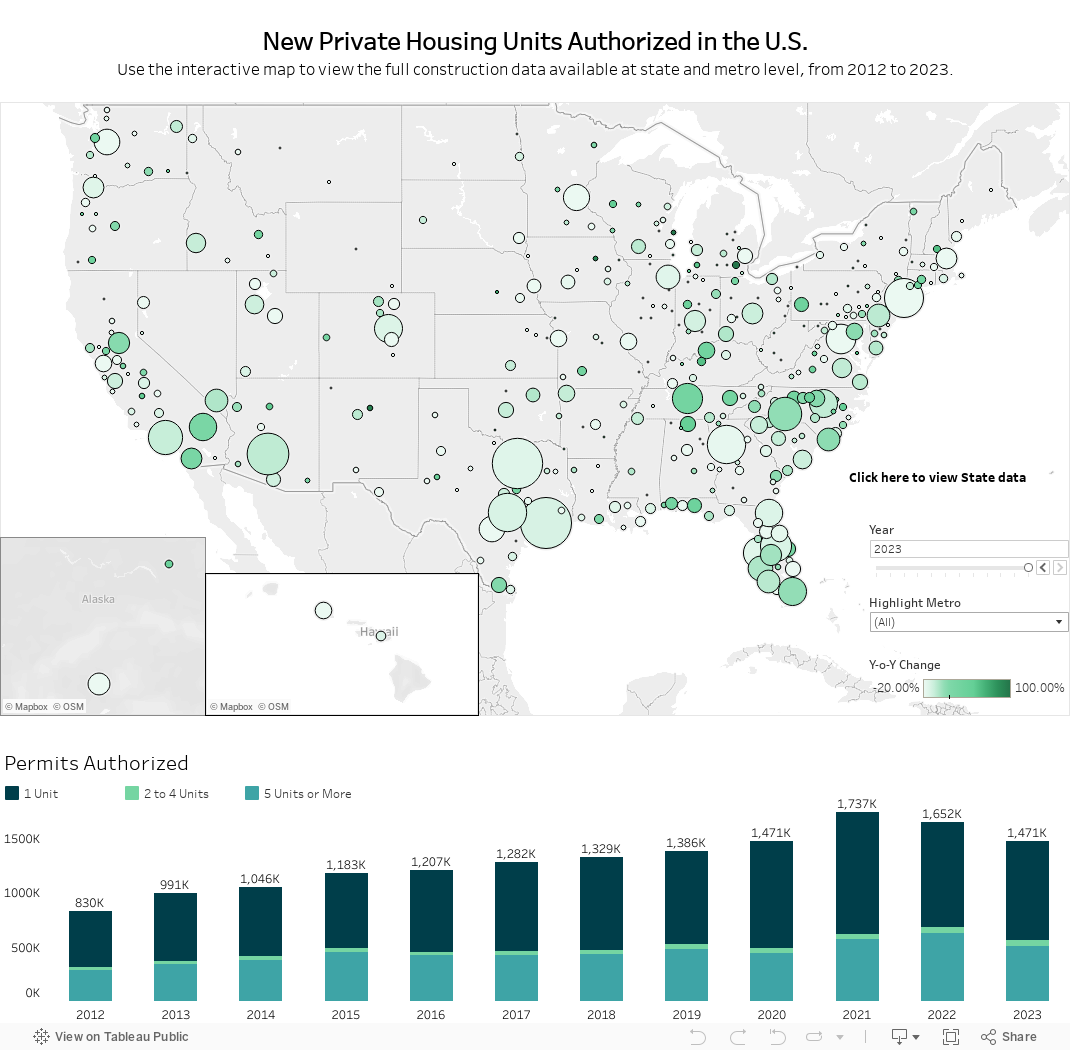
With 531,830 permits, Texas, Florida and California make up for more than a third of the total number of housing structures authorized in the U.S. in 2023.
In 2023, just like the year before, Dallas and Houston authorized the most new units. Last year, however, Phoenix took the third spot, pushing New York outside the top three.
Of the 56 large metros included in the analysis, the number of permits issued increased in only 10.
In 2023, the number of authorizations increased in 16 medium metros compared to 2022.
Of the 271 small metros, permitting activity increased in only 90 last year.
Rochester, NY and Seattle-Tacoma-Bellevue, WA recorded the largest drops in the number of permits of all the large metros: In 2023, permits decreased by more than 35% in both metros.
The number of issued permits decreased in 40 medium metro areas. Akron, OH saw the steepest drop, an almost -68% decrease compared to 2022.
Of the 271 small metros in the analysis, permitting activity decreased in 181.
In 2012, there were 5.6 million construction employees, representing 4.24% of the entire workforce at the national level.
The number of workers employed in construction businesses has climbed continuously, with only a minor, pandemic-induced dip in 2020.
Average incomes in the industry have been steadily going up for the past 10 years, and they show no sign of slowing yet.
Although the average income of construction employees has been incrementally higher than the national average income, the gap seems to be closing.
The total number of construction businesses has been increasing, with an especially significant jump in net numbers in the years immediately following the pandemic, 2021 and 2022.
Over the past decade, construction businesses have been consistently increasing, at a Y-o-Y rate of 1.1% to 3.2%.
The New York, NY; Los Angeles, CA; Houston, TX and Dallas, TX metros have the highest number of construction employees, all boasting more than 200,000 and even more than 300,000 employees.
However, metros like Lake Charles, LA; St. George, UT; Cape Coral-Fort Myers, FL; Naples-Marco Island, FL; Baton Rouge, LA; Greeley, CO; Provo-Orem, UT and The Villages, FL have the highest shares of construction employees out of the total number of employed people in the metro, all above 10%.
San Jose construction employees have the highest average incomes, earning $3,164 per week.
The New York metro also leads in the construction business category: With 51.473 construction-related businesses, New York is in a league of its own.
Methodology
- For this study, we worked with historical data from the U.S. Census Bureau and the U.S. Bureau of Labor Statistics.
- We analyzed yearly data points, beginning with 2012 and ending with 2022, the year with the most recent available data.
- We looked at the number of permits issued and the value of permits issued by housing type, the number of completed units and started units, the average and median square footage of started and completed units, and employment data like the number of construction employees and their income, as well as the number of construction businesses, as defined by the U.S. Census Bureau and the U.S. Bureau of Labor Statistics.
- We extracted data at the national level, but also at regional and state level, as well as metro-level, including all 384 existing U.S. metros.
- We divided the metros into three categories, based on their population:
- Large metros are metros with a population higher than 1,000,000 residents.
- Medium metros are metros with a population between 500,000 and 999,999 residents.
- Small metros are metros with a population less than 500,000 residents.
Fair Use
We encourage and freely grant you permission to reuse, host, or repost the story in this article. When doing so, we only ask that you kindly attribute the authors by linking to Point2Homes.com or this page so that your readers can learn more about this project, the research behind it and its methodology.