

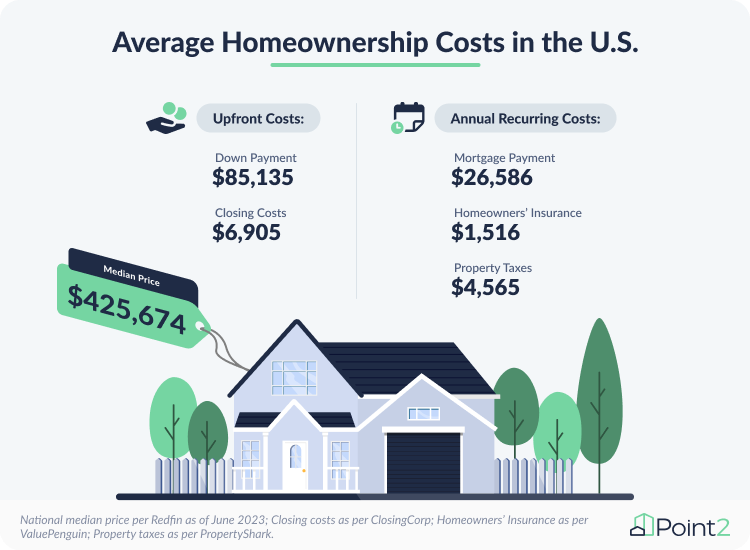
For most Americans, the homebuying journey is daunting in and of itself — without even thinking about the expenses that follow once they check that milestone off their list. And, with the national down payment averaging $85,100, homeownership-related costs risk breaking the bank even before considering recurring mortgage payments, homeowners’ insurance, and property taxes. Still, the cost of that first year as an owner is a beast of its own that cannot be ignored — particularly in the big city.
- In the 100 largest U.S. cities, the cost of the first year of homeownership ranges between $25,100 and $389,900 — which is a staggering 15 times the lower amount.
- First-year expenses are less than $80,000 in 16 big cities, most of them in the Midwest. Detroit and Ohio’s Toledo and Cleveland top the list of markets with the cheapest homeownership costs.
- Homeownership costs go above $200,000 in 15 other markets, 11 of which are in California. Alongside San Francisco, the most excessive first-year expenses are in Fremont, San Jose, Irvine, and Los Angeles.
- In 75 markets, it takes more than a decade of saving up to cover the full cost of the first year of homeownership. The average homebuyer is particularly priced out in LA, NYC, and Irvine, CA, where matching the amount would require more than 20 years.
Point2 wanted to see where new buyers would have a difficult time covering these expenses and where they could have a financially smoother first year of homeownership. We looked at the 100 largest U.S. markets to determine the costs associated with the first year of homeownership, focusing on two types of expenses: Upfront costs and annual recurring costs.
Upfront costs consist of a set 20% down payment, as well as closing costs such as origination charges, title insurance, inspection fees, and other service fees. Annual recurring costs include mortgage payments (assuming a 30-year fixed-rate mortgage with an average interest rate of 6.78%), homeowners’ insurance, and average property tax.
For a clearer glimpse into what first-time buyers are experiencing, we analyzed the number of years it would take for the average renter to save up for the upfront costs required to buy, as well as how many years it would take to cover the full cost of the first year of homeownership.
 Cheapest 1st Year of Homeownership: Only 16 Big Cities With Homeownership Costs Below $80,000
First-year expenses 5 times cheaper in some Midwestern cities than in California
The homeownership rate in the United States has been hovering around 66% lately. And, although fluctuations are to be expected, there is little hope of the needle suddenly moving more in favor of homebuyers. Rather, climbing interest rates, high prices, and squeezed inventory create a cocktail doomed to make some people postpone homebuying — and others rethink the decision altogether.
It’s essential for aspiring homebuyers to see the full financial picture of the first year of ownership in deciding whether to go for it or wait it out. Plus, with first-year homeownership costs surpassing $100,000 in one-third of the country’s 100 largest markets, it’s no wonder many choose the latter.
Yet, despite the tough financial journey of first-time buyers, there are some large cities where going for it might be the right answer. More precisely, in 16 of the largest U.S. cities, the cost of homeownership falls below $80,000. Notably, this benchmark feels more like a best-case scenario the more you look into the six-digit costs in most of the other large markets.
The majority of the big markets with the cheapest first year are in the Midwest, the region with the highest homeownership rate, according to the U.S. Census. In fact, homeownership costs here can be about five times less expensive than in some famously expensive California markets.
Namely, Detroit, MI displays the smallest overall ownership costs of just over $25,100, as well as the only median home price below $100,000. Ohio’s Toledo and Cleveland take the next spots on the list, with the cost of the first year around $38,000. Similarly, Fort Wayne, IN and St. Louis, MO take the fourth and fifth spots on the list, with first-year costs of about $59,800 and 61,600.
It's important to note here that first-year homeownership costs in these cities are smaller due to lower home prices and, subsequently, more reasonable 20% down payments and mortgages compared to many of the other large markets in the country. For instance, Memphis' $41,400 average down payment is easier to digest than Nashville's, which is more than twice that amount, at $89,800. Similarly, a $15,000 annual mortgage would be easier to take on in Lubbock as compared not only to Texas powerhouses like Austin ($38,000) or Dallas ($28,300), but also to the likes of Plano ($33,850) or Irving ($26,200).
Costliest 1st Year of Homeownership: Almost $390K in San Francisco & Fremont
First-year costs cheaper in Los Angeles than in San Jose & Irvine, CA
Understanding more about the down payment and closing costs — as well as subsequent recurring costs, such as mortgage payments, insurance, and property taxes — can help homebuyers plan their budget effectively. But no amount of budgeting prepares the average buyer for the first year of homeownership in the more expensive cities in the country.
In 15 of the 100 largest markets, the full cost of the first year of homeownership exceeds $200,000. Understandably, these are the same cities that have some of the highest median prices in the U.S., as well as the most expensive 20% down payments that range from $143,600 to a wallet-wrenching $282,000 (looking at you, San Francisco).
With total first-year costs of $389,900, San Francisco is the most unaffordable for new owners. On top of a median home price of $1.4 million and the highest down payment on the list, the average first-time homebuyer here also faces the steepest mortgage (more than $88,000), as well as annual property taxes of more than $10,400.
San Francisco is closely followed by Fremont with year-one costs of more than $389,100, as well as six other California cities — all with homeownership expenses exceeding $236,000: San Jose, Irvine, Los Angeles, San Diego, Oakland, and Anaheim.
On the opposite coast, navigating costs as a fresh homeowner is tough in New York City, too. Although scenarios might look different borough by borough, homeownership expenses in NYC reach nearly $233,600 during the first year. Likewise, newly-minted owners face a similar situation in Seattle ($232,530), as well as in a few other large markets where homeownership-related costs during the first year go above $200,000 – Scottsdale, AZ, Boston, MA, Chula Vista, Santa Ana, and Long Beach, CA. Incidentally, the vast majority of these expensive large markets are located in metro areas that are expected to keep seeing spikes in home prices, as well as mortgages, in the months to come.
Saving Up for Homeownership
More than a decade to cover upfront costs in 26 big cities; Just as hard to save up in Irvine, CA as in NYC
What goes into the first year of homeownership is exorbitant, but for many aspiring buyers, the down payment is the first significant hurdle upon buying a home. While purchasing a home comes with adjacent closing costs, they nevertheless feel like a drop in the ocean next to the 20% down payment.
The reality is that, in most cases, budgeting is crucial in order to cover the one-and-done upfront costs (comprising the down payment and closing costs such as origination charges, title insurance, inspection fees, and other service fees). To that end, the 50/30/20 budgeting rule helps calculate how many years aspiring homebuyers would need to save to cover the upfront expenses. Accordingly, we assumed a renter household would put 20% of their yearly income toward homeownership.
As it turns out, both closing costs and down payments vary considerably depending on location, which means that homeownership may be more attainable in some large markets than in others.
It can take between 3 and 18 years of saving to cover the upfront costs in the 100 most populous U.S. cities. At one end of the spectrum, there are cities like Detroit, Toledo, Cleveland, and Fort Wayne, IN, where a determined renter would need the least amount of time to save up for homeownership. Conversely, NYC and a cohort of California markets are on the other side of the affordability continuum, requiring up to 18.2 years of uninterrupted saving to reach their ownership goals.
The average first-time homebuyer in California struggles to get a toehold in major housing markets. Those looking to make their first purchase in notoriously expensive cities already know to brace themselves for stiff upfront costs. In fact, going by the 50/30/20 rule, renters in LA would need to save up for more than 18 years in order to cover the upfront costs of homeownership. Meanwhile, in Irvine, it takes as much as in New York City (15 years), while renters in San Jose, Oakland, and Miami would have to set aside money for more than 14 years.
Covering the Full 1st Year of Homeownership
10 years or less in one-quarter of the nation’s largest markets & nearly 25 years of saving in LA
Upfront costs are just the first obstacle on the way toward homeownership. But after solving that problem, next on the list for buyers are the recurring yearly costs. The mortgage, in particular, plays a crucial role in how much new homeowners will shell out during their first year “on the job” — on top of homeowners’ insurance and property taxes.
Let’s assume a renter household in one of the 100 major U.S. cities sets aside 20% of the average yearly income toward homeownership. Even if they never miss a beat, it can take renters anywhere between 4 and 24.5 years of saving to cover the full cost of the first year.
Clearly, it’s an understatement that first-time homebuyers in LA and NYC need a lot more money than in most cities — and that applies to their first year of ownership, too: It can take more than 20 years of saving to cover all of the expenses of the first year in NYC and Irvine, CA. Even so, in Los Angeles, the picture is even bleaker because saving up to cover the cost of the entire first year of homeownership — upfront, as well as annual costs — would take close to 25 years.
Renters in San Jose, Oakland, and Miami would need almost 20 years. At the same time, those in San Francisco, Anaheim, Boston, and Long Beach would require around 18 years.
In any case, homebuyers dealing with brand-new ownership-related expenses may feel the financial weight as soon as they make the decision to purchase. As major markets stray increasingly far from the promised land of homeownership, the first year of owning a home can turn into a disheartening experience for an entire generation of big-city first-time buyers.
Check out the table below for the main data points used in the study. Use the filters to rank the 100 most populous cities in the United States based on any variable of interest, including: down payment (20%), closing costs, mortgage payments, homeowners’ insurance, property taxes, total upfront costs, total annual costs, costs of the first year of homeownership, years necessary to save up in order to cover these costs and more.
| City | Median Home Price | 1st Year of Homeownership Costs | Down Payment (20%) | Closing Costs | Total Upfront Costs | Annual Mortgage Payments | Annual Homeowners' Insurance | Annual Property Taxes | Total Annual Recurring Costs | Median Renter Household Income | 20% of Income Aside | Years to Cover Upfront Costs | Years to Cover 1st Year of Homeownership |
|---|---|---|---|---|---|---|---|---|---|---|---|---|---|
| New York City, NY | $755,000 | $233,598 | $151,000 | $19,491 | $170,491 | $47,155 | $1,418 | $14,534 | $63,107 | $56,764 | $11,353 | 15.0 | 20.6 |
| Los Angeles, CA | $970,000 | $270,954 | $194,000 | $6,578 | $200,578 | $60,583 | $1,839 | $7,954 | $70,376 | $55,205 | $11,041 | 18.2 | 24.5 |
| Chicago, IL | $360,000 | $112,147 | $72,000 | $7,922 | $79,922 | $22,485 | $1,856 | $7,884 | $32,225 | $49,455 | $9,891 | 8.1 | 11.3 |
| Houston, TX | $342,000 | $104,237 | $68,400 | $4,656 | $73,056 | $21,360 | $2,536 | $7,285 | $31,181 | $43,771 | $8,754 | 8.3 | 11.9 |
| Phoenix, AZ | $440,000 | $124,214 | $88,000 | $4,303 | $92,303 | $27,481 | $1,614 | $2,816 | $31,911 | $51,091 | $10,218 | 9.0 | 12.2 |
| Philadelphia, PA | $271,250 | $84,146 | $54,250 | $9,370 | $63,620 | $16,941 | $736 | $2,848 | $20,526 | $43,004 | $8,601 | 7.4 | 9.8 |
| San Antonio, TX | $280,000 | $86,832 | $56,000 | $4,228 | $60,228 | $17,488 | $2,536 | $6,580 | $26,604 | $43,821 | $8,764 | 6.9 | 9.9 |
| San Diego, CA | $930,000 | $260,477 | $186,000 | $6,462 | $192,462 | $58,085 | $1,839 | $8,091 | $68,015 | $75,472 | $15,094 | 12.8 | 17.3 |
| Dallas, TX | $453,500 | $137,004 | $90,700 | $5,376 | $96,076 | $28,324 | $2,536 | $10,068 | $40,928 | $48,612 | $9,722 | 9.9 | 14.1 |
| San Jose, CA | $1,400,000 | $388,731 | $280,000 | $7,552 | $287,552 | $87,440 | $1,839 | $11,900 | $101,179 | $97,545 | $19,509 | 14.7 | 19.9 |
| Austin, TX | $609,500 | $180,809 | $121,900 | $6,420 | $128,320 | $38,068 | $2,536 | $11,885 | $52,489 | $60,534 | $12,107 | 10.6 | 14.9 |
| Jacksonville, FL | $302,250 | $89,787 | $60,450 | $5,321 | $65,771 | $18,878 | $2,207 | $2,932 | $24,016 | $44,995 | $8,999 | 7.3 | 10.0 |
| Fort Worth, TX | $343,000 | $104,973 | $68,600 | $4,662 | $73,262 | $21,423 | $2,536 | $7,752 | $31,711 | $49,590 | $9,918 | 7.4 | 10.6 |
| Columbus, OH | $290,000 | $87,090 | $58,000 | $3,788 | $61,788 | $18,113 | $1,215 | $5,974 | $25,302 | $48,937 | $9,787 | 6.3 | 8.9 |
| Indianapolis, IN | $249,900 | $73,148 | $49,980 | $3,086 | $53,066 | $15,608 | $1,500 | $2,974 | $20,082 | $44,221 | $8,844 | 6.0 | 8.3 |
| Charlotte, NC | $427,000 | $122,051 | $85,400 | $3,784 | $89,184 | $26,669 | $1,800 | $4,398 | $32,867 | $56,211 | $11,242 | 7.9 | 10.9 |
| San Francisco, CA | $1,410,000 | $389,910 | $282,000 | $7,573 | $289,573 | $88,064 | $1,839 | $10,434 | $100,337 | $104,490 | $20,898 | 13.9 | 18.7 |
| Seattle, WA | $825,500 | $232,530 | $165,100 | $5,912 | $171,012 | $51,558 | $1,292 | $8,668 | $61,518 | $75,936 | $15,187 | 11.3 | 15.3 |
| Denver, CO | $600,000 | $169,253 | $120,000 | $4,799 | $124,799 | $37,474 | $2,900 | $4,080 | $44,454 | $65,673 | $13,135 | 9.5 | 12.9 |
| Oklahoma City, OK | $266,495 | $78,745 | $53,299 | $3,326 | $56,625 | $16,644 | $2,278 | $3,198 | $22,120 | $41,413 | $8,283 | 6.8 | 9.5 |
| Nashville, TN | $449,000 | $129,719 | $89,800 | $5,837 | $95,637 | $28,043 | $2,088 | $3,951 | $34,082 | $52,082 | $10,416 | 9.2 | 12.5 |
| El Paso, TX | $253,000 | $79,534 | $50,600 | $4,069 | $54,669 | $15,802 | $2,536 | $6,527 | $24,865 | $36,772 | $7,354 | 7.4 | 10.8 |
| Washington, D.C. | $606,000 | $178,296 | $121,200 | $14,718 | $135,918 | $37,849 | $893 | $3,636 | $42,378 | $68,231 | $13,646 | 10.0 | 13.1 |
| Boston, MA | $810,000 | $227,102 | $162,000 | $6,350 | $168,350 | $50,590 | $1,844 | $6,318 | $58,752 | $62,594 | $12,519 | 13.4 | 18.1 |
| Las Vegas, NV | $410,000 | $116,309 | $82,000 | $4,934 | $86,934 | $25,607 | $1,144 | $2,624 | $29,375 | $42,500 | $8,500 | 10.2 | 13.7 |
| Portland, OR | $560,000 | $158,628 | $112,000 | $4,442 | $116,442 | $34,976 | $1,106 | $6,104 | $42,186 | $55,396 | $11,079 | 10.5 | 14.3 |
| Detroit, MI | $75,000 | $25,110 | $15,000 | $2,583 | $17,583 | $4,684 | $1,223 | $1,620 | $7,527 | $28,986 | $5,797 | 3.0 | 4.3 |
| Louisville, KY | $250,000 | $73,014 | $50,000 | $3,204 | $53,204 | $15,614 | $1,571 | $2,625 | $19,810 | $37,025 | $7,405 | 7.2 | 9.9 |
| Memphis, TN | $207,200 | $63,198 | $41,440 | $3,890 | $45,330 | $12,941 | $2,088 | $2,839 | $17,868 | $37,335 | $7,467 | 6.1 | 8.5 |
| Baltimore, MD | $235,000 | $74,702 | $47,000 | $7,557 | $54,557 | $14,677 | $1,426 | $4,042 | $20,145 | $40,620 | $8,124 | 6.7 | 9.2 |
| Milwaukee, WI | $204,750 | $63,001 | $40,950 | $3,237 | $44,187 | $12,788 | $846 | $5,180 | $18,814 | $37,895 | $7,579 | 5.8 | 8.3 |
| Albuquerque, NM | $350,000 | $101,904 | $70,000 | $4,576 | $74,576 | $21,860 | $1,338 | $4,130 | $27,328 | $41,355 | $8,271 | 9.0 | 12.3 |
| Fresno, CA | $375,000 | $108,183 | $75,000 | $4,435 | $79,435 | $23,421 | $1,839 | $3,488 | $28,748 | $44,266 | $8,853 | 9.0 | 12.2 |
| Tucson, AZ | $333,000 | $96,256 | $66,600 | $3,914 | $70,514 | $20,798 | $1,614 | $3,330 | $25,742 | $40,163 | $8,033 | 8.8 | 12.0 |
| Sacramento, CA | $477,000 | $136,309 | $95,400 | $4,842 | $100,242 | $29,792 | $1,839 | $4,436 | $36,067 | $56,504 | $11,301 | 8.9 | 12.1 |
| Mesa, AZ | $465,000 | $131,006 | $93,000 | $4,374 | $97,374 | $29,042 | $1,614 | $2,976 | $33,632 | $53,579 | $10,716 | 9.1 | 12.2 |
| Kansas City, MO | $294,000 | $85,860 | $58,800 | $3,001 | $61,801 | $18,362 | $1,492 | $4,204 | $24,059 | $45,851 | $9,170 | 6.7 | 9.4 |
| Atlanta, GA | $439,200 | $126,616 | $87,840 | $5,240 | $93,080 | $27,431 | $1,318 | $4,787 | $33,536 | $49,738 | $9,948 | 9.4 | 12.7 |
| Omaha, NE | $282,000 | $85,916 | $56,400 | $3,258 | $59,658 | $17,613 | $2,554 | $6,091 | $26,258 | $42,576 | $8,515 | 7.0 | 10.1 |
| Colorado Springs, CO | $464,000 | $131,587 | $92,800 | $4,355 | $97,155 | $28,980 | $2,900 | $2,552 | $34,432 | $55,054 | $11,011 | 8.8 | 12.0 |
| Raleigh, NC | $426,500 | $121,615 | $85,300 | $3,783 | $89,083 | $26,638 | $1,800 | $4,094 | $32,532 | $48,672 | $9,734 | 9.2 | 12.5 |
| Virginia Beach, VA | $375,000 | $109,710 | $75,000 | $6,511 | $81,511 | $23,421 | $1,290 | $3,488 | $28,199 | $57,015 | $11,403 | 7.1 | 9.6 |
| Long Beach, CA | $800,000 | $224,385 | $160,000 | $6,020 | $166,020 | $49,966 | $1,839 | $6,560 | $58,365 | $62,117 | $12,423 | 13.4 | 18.1 |
| Miami, FL | $590,000 | $171,303 | $118,000 | $8,287 | $126,287 | $36,850 | $2,207 | $5,959 | $45,016 | $43,857 | $8,771 | 14.4 | 19.5 |
| Oakland, CA | $915,000 | $256,458 | $183,000 | $6,419 | $189,419 | $57,148 | $1,839 | $8,052 | $67,039 | $65,065 | $13,013 | 14.6 | 19.7 |
| Minneapolis, MN | $340,000 | $100,037 | $68,000 | $4,126 | $72,126 | $21,235 | $2,188 | $4,488 | $27,911 | $50,839 | $10,168 | 7.1 | 9.8 |
| Tulsa, OK | $240,000 | $71,386 | $48,000 | $3,238 | $51,238 | $14,990 | $2,278 | $2,880 | $20,148 | $38,466 | $7,693 | 6.7 | 9.3 |
| Bakersfield, CA | $399,990 | $116,257 | $79,998 | $4,518 | $84,516 | $24,982 | $1,839 | $4,920 | $31,741 | $46,587 | $9,317 | 9.1 | 12.5 |
| Wichita, KS | $235,000 | $71,050 | $47,000 | $3,724 | $50,724 | $14,677 | $2,265 | $3,384 | $20,326 | $37,893 | $7,579 | 6.7 | 9.4 |
| Arlington, TX | $344,000 | $105,263 | $68,800 | $4,667 | $73,467 | $21,485 | $2,536 | $7,774 | $31,796 | $43,446 | $8,689 | 8.5 | 12.1 |
| Aurora, CO | $482,450 | $137,202 | $96,490 | $4,399 | $100,889 | $30,132 | $2,900 | $3,281 | $36,313 | $50,694 | $10,139 | 10.0 | 13.5 |
| Tampa, FL | $441,000 | $129,776 | $88,200 | $6,754 | $94,954 | $27,544 | $2,207 | $5,072 | $34,822 | $48,861 | $9,772 | 9.7 | 13.3 |
| New Orleans, LA | $362,000 | $104,420 | $72,400 | $4,493 | $76,893 | $22,609 | $2,058 | $2,860 | $27,527 | $29,452 | $5,890 | 13.1 | 17.7 |
| Cleveland, OH | $119,950 | $38,569 | $23,990 | $2,862 | $26,852 | $7,492 | $1,215 | $3,011 | $11,717 | $28,743 | $5,749 | 4.7 | 6.7 |
| Anaheim, CA | $844,500 | $236,303 | $168,900 | $6,148 | $175,048 | $52,745 | $1,839 | $6,672 | $61,255 | $64,221 | $12,844 | 13.6 | 18.4 |
| Honolulu, HI | $499,000 | $138,544 | $99,800 | $4,994 | $104,794 | $31,166 | $987 | $1,597 | $33,750 | $65,111 | $13,022 | 8.0 | 10.6 |
| Henderson, NV | $465,000 | $131,360 | $93,000 | $5,198 | $98,198 | $29,042 | $1,144 | $2,976 | $33,162 | $58,893 | $11,779 | 8.3 | 11.2 |
| Stockton, CA | $451,500 | $129,520 | $90,300 | $4,757 | $95,057 | $28,199 | $1,839 | $4,425 | $34,463 | $51,125 | $10,225 | 9.3 | 12.7 |
| Lexington, KY | $322,355 | $93,234 | $64,471 | $3,513 | $67,984 | $20,133 | $1,571 | $3,546 | $25,250 | $39,817 | $7,963 | 8.5 | 11.7 |
| Corpus Christi, TX | $282,000 | $86,513 | $56,400 | $4,240 | $60,640 | $17,613 | $2,536 | $5,725 | $25,873 | $45,512 | $9,102 | 6.7 | 9.5 |
| Riverside, CA | $620,000 | $176,387 | $124,000 | $5,377 | $129,377 | $38,723 | $1,839 | $6,448 | $47,010 | $55,615 | $11,123 | 11.6 | 15.9 |
| Santa Ana, CA | $718,000 | $201,675 | $143,600 | $5,720 | $149,320 | $44,844 | $1,839 | $5,672 | $52,355 | $69,522 | $13,904 | 10.7 | 14.5 |
| Orlando, FL | $390,000 | $114,733 | $78,000 | $6,190 | $84,190 | $24,358 | $2,207 | $3,978 | $30,543 | $48,370 | $9,674 | 8.7 | 11.9 |
| Irvine, CA | $1,400,000 | $387,891 | $280,000 | $7,552 | $287,552 | $87,440 | $1,839 | $11,060 | $100,339 | $96,140 | $19,228 | 15.0 | 20.2 |
| Cincinnati, OH | $277,250 | $83,144 | $55,450 | $3,729 | $59,179 | $17,316 | $1,215 | $5,434 | $23,965 | $28,996 | $5,799 | 10.2 | 14.3 |
| Newark, NJ | $398,500 | $118,709 | $79,700 | $4,592 | $84,292 | $24,889 | $1,359 | $8,169 | $34,417 | $38,583 | $7,717 | 10.9 | 15.4 |
| St. Paul, MN | $300,525 | $89,435 | $60,105 | $3,954 | $64,059 | $18,770 | $2,188 | $4,418 | $25,376 | $49,022 | $9,804 | 6.5 | 9.1 |
| Pittsburgh, PA | $275,000 | $83,752 | $55,000 | $5,340 | $60,340 | $17,176 | $736 | $5,500 | $23,412 | $39,713 | $7,943 | 7.6 | 10.5 |
| Greensboro, NC | $285,150 | $82,896 | $57,030 | $3,291 | $60,321 | $17,810 | $1,800 | $2,966 | $22,575 | $39,546 | $7,909 | 7.6 | 10.5 |
| St. Louis, MO | $208,300 | $61,635 | $41,660 | $2,890 | $44,550 | $13,010 | $1,492 | $2,583 | $17,085 | $34,656 | $6,931 | 6.4 | 8.9 |
| Lincoln, NE | $295,000 | $89,140 | $59,000 | $3,291 | $62,291 | $18,425 | $2,554 | $5,871 | $26,849 | $41,417 | $8,283 | 7.5 | 10.8 |
| Anchorage, AK | $401,900 | $116,925 | $80,380 | $4,470 | $84,850 | $25,101 | $1,307 | $5,667 | $32,075 | $54,328 | $10,866 | 7.8 | 10.8 |
| Plano, TX | $542,000 | $161,589 | $108,400 | $5,961 | $114,361 | $33,852 | $2,536 | $10,840 | $47,228 | $74,577 | $14,915 | 7.7 | 10.8 |
| Durham, NC | $418,000 | $120,160 | $83,600 | $3,762 | $87,362 | $26,107 | $1,800 | $4,891 | $32,798 | $49,104 | $9,821 | 8.9 | 12.2 |
| Jersey City, NJ | $625,000 | $184,690 | $125,000 | $5,733 | $130,733 | $39,036 | $1,359 | $13,563 | $53,957 | $74,742 | $14,948 | 8.7 | 12.4 |
| Chandler, AZ | $521,250 | $146,357 | $104,250 | $4,601 | $108,851 | $32,556 | $1,614 | $3,336 | $37,506 | $74,929 | $14,986 | 7.3 | 9.8 |
| Chula Vista, CA | $775,000 | $217,868 | $155,000 | $5,882 | $160,882 | $48,404 | $1,839 | $6,743 | $56,986 | $60,366 | $12,073 | 13.3 | 18.0 |
| Buffalo, NY | $222,500 | $71,489 | $44,500 | $5,823 | $50,323 | $13,897 | $1,418 | $5,852 | $21,166 | $29,893 | $5,979 | 8.4 | 12.0 |
| North Las Vegas, NV | $398,500 | $113,095 | $79,700 | $4,811 | $84,511 | $24,889 | $1,144 | $2,550 | $28,584 | $53,957 | $10,791 | 7.8 | 10.5 |
| Gilbert, AZ | $572,500 | $160,279 | $114,500 | $4,744 | $119,244 | $35,757 | $1,614 | $3,664 | $41,035 | $82,130 | $16,426 | 7.3 | 9.8 |
| Madison, WI | $395,950 | $116,880 | $79,190 | $3,760 | $82,950 | $24,730 | $846 | $8,355 | $33,930 | $45,089 | $9,018 | 9.2 | 13.0 |
| Reno, NV | $546,587 | $153,316 | $109,317 | $5,656 | $114,973 | $34,138 | $1,144 | $3,061 | $38,343 | $54,111 | $10,822 | 10.6 | 14.2 |
| Toledo, OH | $120,000 | $38,008 | $24,000 | $2,862 | $26,862 | $7,495 | $1,215 | $2,436 | $11,146 | $29,387 | $5,877 | 4.6 | 6.5 |
| Fort Wayne, IN | $202,950 | $59,779 | $40,590 | $2,964 | $43,554 | $12,676 | $1,500 | $2,050 | $16,225 | $39,474 | $7,895 | 5.5 | 7.6 |
| Lubbock, TX | $240,000 | $74,390 | $48,000 | $3,992 | $51,992 | $14,990 | $2,536 | $4,872 | $22,398 | $37,001 | $7,400 | 7.0 | 10.1 |
| St. Petersburg, FL | $429,400 | $125,667 | $85,880 | $6,639 | $92,519 | $26,819 | $2,207 | $4,122 | $33,148 | $50,529 | $10,106 | 9.2 | 12.4 |
| Laredo, TX | $259,500 | $80,486 | $51,900 | $4,107 | $56,007 | $16,208 | $2,536 | $5,735 | $24,479 | $35,483 | $7,097 | 7.9 | 11.3 |
| Irving, TX | $420,000 | $127,270 | $84,000 | $5,178 | $89,178 | $26,232 | $2,536 | $9,324 | $38,092 | $64,156 | $12,831 | 7.0 | 9.9 |
| Chesapeake, VA | $392,500 | $114,804 | $78,500 | $6,692 | $85,192 | $24,514 | $1,290 | $3,807 | $29,612 | $48,555 | $9,711 | 8.8 | 11.8 |
| Winston-Salem, NC | $280,000 | $81,646 | $56,000 | $3,278 | $59,278 | $17,488 | $1,800 | $3,080 | $22,368 | $35,386 | $7,077 | 8.4 | 11.5 |
| Glendale, AZ | $425,000 | $120,140 | $85,000 | $4,262 | $89,262 | $26,544 | $1,614 | $2,720 | $30,878 | $49,269 | $9,854 | 9.1 | 12.2 |
| Enterprise, NV | $430,000 | $121,783 | $86,000 | $5,030 | $91,030 | $26,857 | $1,144 | $2,752 | $30,753 | $59,995 | $11,999 | 7.6 | 10.1 |
| Scottsdale, AZ | $820,000 | $227,719 | $164,000 | $5,642 | $169,642 | $51,215 | $1,614 | $5,248 | $58,077 | $72,981 | $14,596 | 11.6 | 15.6 |
| Garland, TX | $340,000 | $103,963 | $68,000 | $4,644 | $72,644 | $21,235 | $2,536 | $7,548 | $31,319 | $47,613 | $9,523 | 7.6 | 10.9 |
| Boise, ID | $510,500 | $144,005 | $102,100 | $4,539 | $106,639 | $31,884 | $1,398 | $4,084 | $37,366 | $50,340 | $10,068 | 10.6 | 14.3 |
| Norfolk, VA | $306,750 | $91,188 | $61,350 | $5,800 | $67,150 | $19,159 | $1,290 | $3,589 | $24,038 | $42,788 | $8,558 | 7.8 | 10.7 |
| Arlington, VA | $650,000 | $188,236 | $130,000 | $9,524 | $139,524 | $40,597 | $1,290 | $6,825 | $48,712 | $101,660 | $20,332 | 6.9 | 9.3 |
| Spokane, WA | $385,000 | $111,247 | $77,000 | $4,289 | $81,289 | $24,046 | $1,292 | $4,620 | $29,958 | $42,890 | $8,578 | 9.5 | 13.0 |
| Fremont, CA | $1,400,000 | $389,151 | $280,000 | $7,552 | $287,552 | $87,440 | $1,839 | $12,320 | $101,599 | $129,515 | $25,903 | 11.1 | 15.0 |
| Richmond, VA | $381,000 | $112,126 | $76,200 | $6,573 | $82,773 | $23,796 | $1,290 | $4,267 | $29,353 | $40,327 | $8,065 | 10.3 | 13.9 |
Methodology:
Point2, a division of Yardi Systems Inc., covers real estate trends and news. Point2 studies are based on internal data, public records, governmental sources, online research and other reliable third-party agencies.
- For this study, we considered the 100 largest cities in the United States.
- The median home prices were sourced from Redfin, PropertyShark, and realtor.com as of June 2023.
- The study assumes a set 20% down payment, as well as closing costs from SmartAsset’s property taxes calculator (which include origination charges, title insurance, inspection fees, and other service fees). It excludes escrow and pre-paid expenses such as homeowners’ insurance.
- The closing costs at national level are sourced from ClosingCorp.
- We assumed a 30-year fixed-rate mortgage with an average interest rate of 6.78% as reported by FRED on June 1.
- Homeowners insurance data is from Value Penguin as of June 2023, measured at state level.
- The tax rate is at county level, sourced from SmartAsset. Property tax rate at national level is based on an average of the 50 U.S. states and D.C., sourced from PropertyShark.
- For the purpose of this study, we assumed a renter household saves 20% of the median household income sourced from the 2021 ACS 1-year estimates, adjusted for 2023 using the Employment Cost Index Wage and Salaries increase from December 2021-March 2023 (15 months).
- The number of years needed to save to cover the cost of upfront costs as well as the full first year of homeownership was calculated based on the 50/30/20 budgeting rule stating that 20% of income should go to savings.
- Excluded from the study are utilities and municipal services, which one must pay regardless of owning or renting, hence not influencing homeownership costs as much as other strictly owner-related expenses.
Fair use and redistribution
We encourage and freely grant permission to reuse, host or repost this article. When doing so, we only ask that you kindly attribute the authors by linking to Point2Homes.com or this page, so that your readers can learn more about this project, the research behind it and its methodology.
