
Although the StatCan definitions for “private dwelling occupied by usual residents” and “usual place of residence” have generated some discussions about what constitutes vacant dwellings, the number of homes that are occupied by “not usual” residents is a vital housing parameter.
The importance of this indicator becomes especially clear in the heated debate around the effect of vacant homes on housing affordability. Started by an OECD report that was based on StatCan’s 2016 findings, the debate has some analysts claiming that empty homes contribute to the erosion of home affordability, while others believe this indicator is irrelevant.
Whether they’re new condos that just hit the market, vacation and secondary homes, underused investment properties or even rentals between successive tenants, Point2 analysts discovered that Canada’s “ghost homes” may be a point of contention. However, tackling the matter is worthwhile. As places that don’t have a usual resident (yet), the existence of vacant dwellings may — depending on the local context — help inform various housing policies.
That’s because the number of private dwellings that are not occupied by usual residents in Canada hovers around 1.3 million, according to the most recent Statistics Canada figures. However, while 2021 numbers are still pretty high, they have dropped since the previous Census. What’s more, the national vacancy rate in Canada is falling for the first time in 20 years.
And considering the measures taken to reduce the number of empty homes — like Vancouver’s Empty Homes Tax and the proposed Underused Housing Tax — the private dwellings that were still vacant in May 2021 might be, in a larger share, newly constructed homes ready for their new owners and tenants.
With new Statistics Canada figures available for occupied and unoccupied private dwellings, Point2 analysts charted the 10-year evolution of vacancy rates and empty homes numbers across Canada and the 150 largest Canadian cities. We also looked at population changes in these cities during the same timeframe to see if there were any correlations between demographic changes and the reported vacancy rates.
Here are the main findings at the national and city level:
- Although the number of unoccupied homes remained high (1.3 million), the vacancy rate in 2021 (8%) fell to a level close to that of 20 years ago (in 2001, Canada’s vacancy rate was 7.8%).
- Compared to 2011, vacancy rates fell in 87 of the 150 most populous Canadian cities, whereas they stayed the same in one city and increased in 62 large cities.
- St. Albert, AB experienced the largest increase in vacancy rates in the last 10 years (93%), while Saanich, BC had the largest decrease (-53%).
- Four cities had vacancy rates above 10%: Kawartha Lakes, ON (16%), Wood Buffalo, AB (14.8%), Fort Erie, ON (11.3%) and Innisfil, ON (10.4%).
- Five cities in Quebec (Sainte-Julie, Mascouche, Repentigny, Terrebonne and Blainville) and two cities in Ontario (Halton Hills and Ajax) had the lowest vacancy rates in Canada, all below 2%.
In B.C., Kelowna, Victoria, Vernon & Vancouver Have Highest Vacancy Rates, But Delta Saw Biggest Increase from 2011
Both Kelowna and Victoria had vacancy rates of 7.3% in 2021. But, despite being two of the highest rates in British Columbia, they were actually down (21% and 27%, respectively) compared to a decade ago. The same was true for Vernon: It reached a rate of 7.1% after decreasing 29% since 2011.
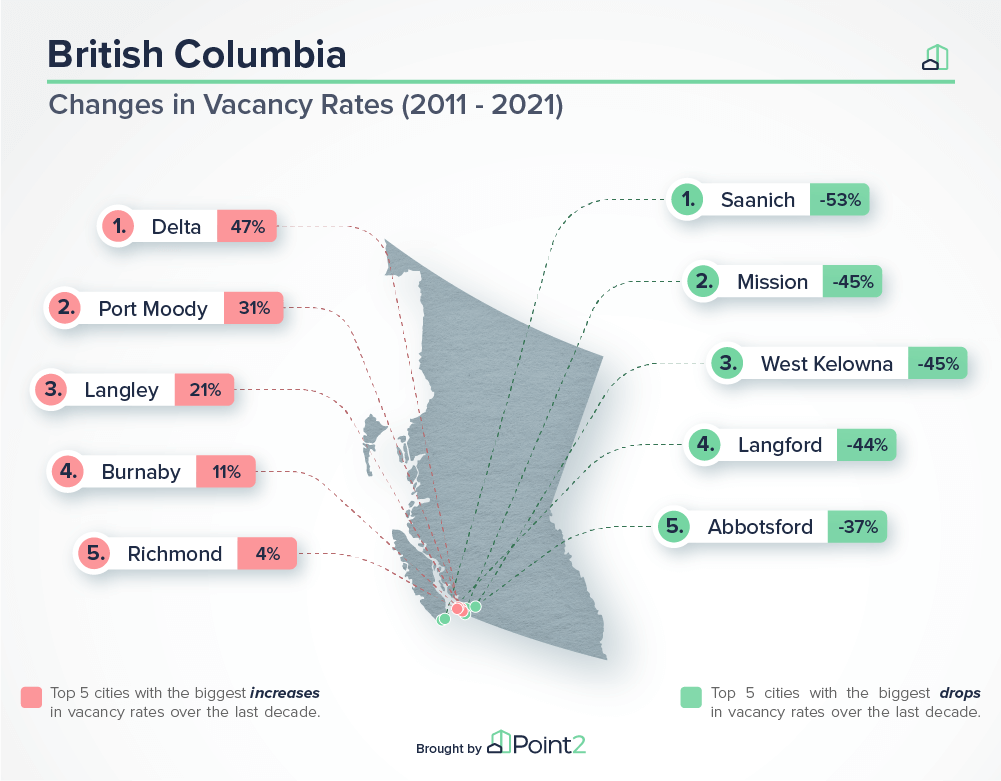 At the same time, Vancouver — a city that entered the spotlight due to its high vacancy rates and taxes aimed at curbing the phenomenon — is finally seeing some changes. Compared to 10 years ago, vacancy rates here were down 9%. And, compared to five years ago, the results were even more spectacular: Vacancy rates were down 14.5% since 2016.
According to the Vancouver Sun:
“This could be due to municipal and provincial regulations and taxes in Vancouver and B.C. that have dampened the demand for housing that’s not used as a primary residence, according to early observations.”
The net number of dwellings that were empty, underused or occupied by “not usual” residents in Vancouver has also decreased since 2016, going from 25,502 to 23,011 last year.
The Prairies: Most Empty Dwellings in Edmonton, AB & Highest Vacancy Rate in Wood Buffalo, AB
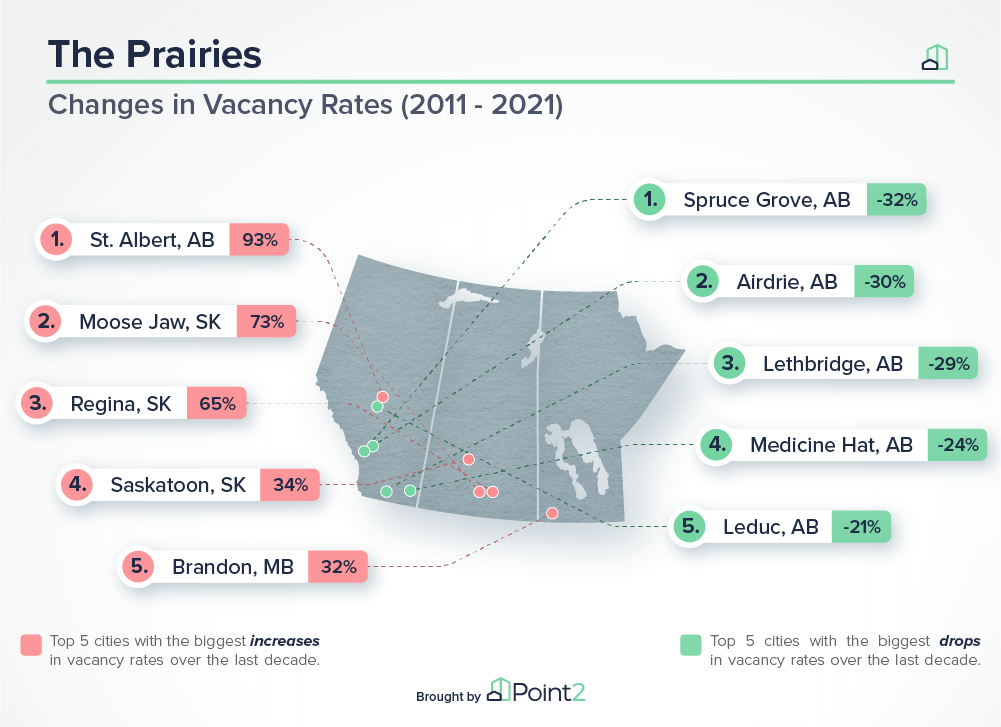 In the last 10 years, the number of unoccupied or underused dwellings nearly or more than doubled in cities like Regina, SK (from 3,568 to 7,005), Moose Jaw, SK (from 785 to 1,424) and St. Albert, AB (from 477 to 1,081). However, the three cities with the highest number of empty dwellings were Edmonton, AB (32,453), Calgary, AB (28,761) and Winnipeg, MB (15,034).
Looking further into the changes in share of dwellings occupied by “not usual” residents, the biggest increases were recorded in St. Albert, AB (up 93% since 2011), Moose Jaw, SK (up 73%) and Regina, SK (65%). Interestingly, Moose Jaw was also the city with the smallest population growth: Compared to a decade ago, there was a meager 1.2% increase in the number of residents here.
At the other end of the spectrum, Cochrane, AB saw the largest population increase of all of the Prairie cities included in the analysis: The number of people living in this city jumped by 83.2%.
Québec, Lévis & Victoriaville Saw Largest Increases in Share of Empty Homes, Montreal Has Highest Number of Unoccupied Dwellings
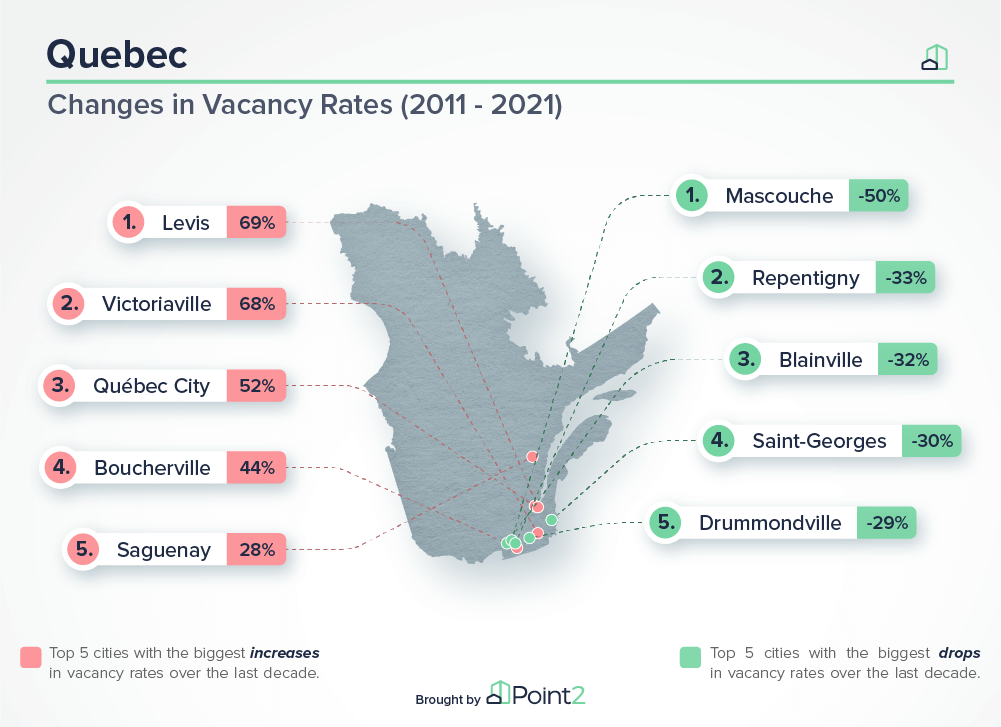 Compared to 2011, Lévis and Victoriaville saw significant increases in vacancy rates, both recording jumps close to 70%. Québec City saw the third-highest increase (52%). However, despite these increases, none of these cities had the biggest vacancy rate of the 36 largest Québec cities included in the analysis. Rather, this title belongs to Shawinigan. Rouyn-Noranda and Montréal followed suit, with vacancy rates of 7.6% and 7.1%, respectively.
Conversely, five Québec cities had vacancy rates of less than 2%, which signals much better occupancy:
- Sainte-Julie
- Mascouche
- Repentigny
- Terrebonne
- Blainville
Moreover, Québec also posted the lowest homeownership rates in Canada, with residents in the province typically leaning toward renting, rather than buying. And this particularity of the province doesn’t show any signs of changing — especially in Montréal. Although almost half of its households are renters, there’s also a staggering number of vacant dwellings in the city, as well: In 2021, more than 62,204 homes were empty.
33 Large Ontario Cities Saw a Drop in Share of Unoccupied Dwellings
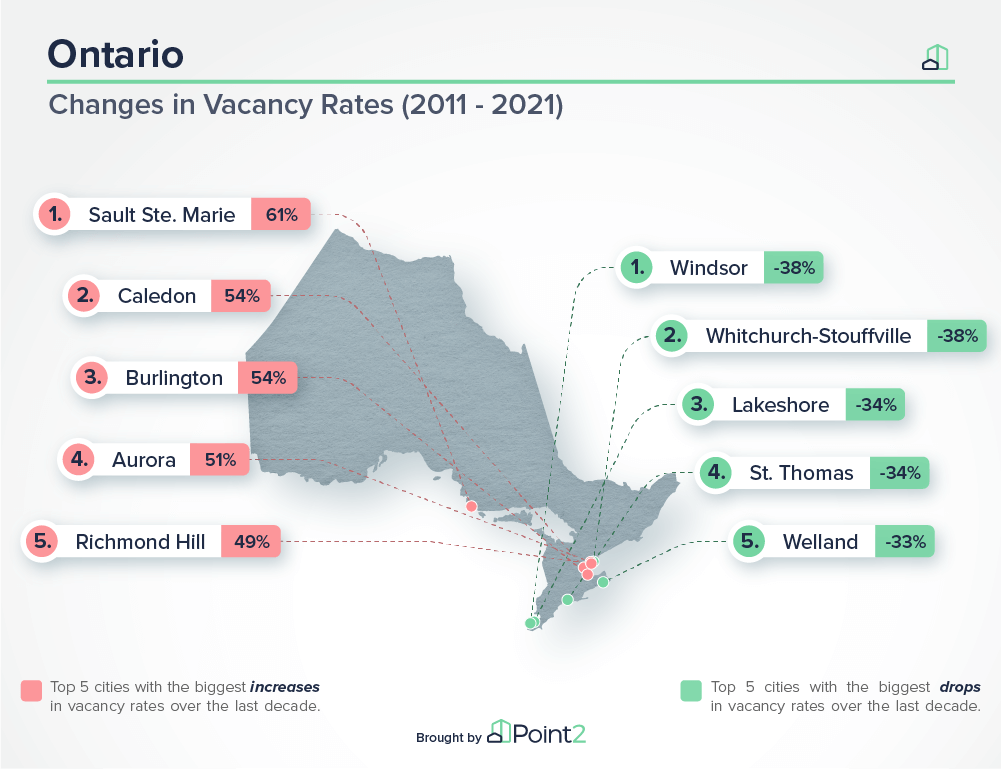 Of the 150 large cities included in the study, 60 are in Ontario. Of these, the majority (33) saw their share of unoccupied dwellings decrease in the last decade. In particular, Whitchurch-Stouffville and Windsor led the way with 38% drops, and six other large cities recorded drops of more than 30%.
However, while the number of dwellings occupied by “not usual” residents increased in Brampton compared to 10 years ago, the vacancy rate here remained unchanged.
In the other 26 large cities, vacancy rates increased, with Sault Ste. Marie stealing the limelight due to a 61% jump.
St. John’s Is the Only Large City in Atlantic Canada that Saw an Increase in Vacancy Rates
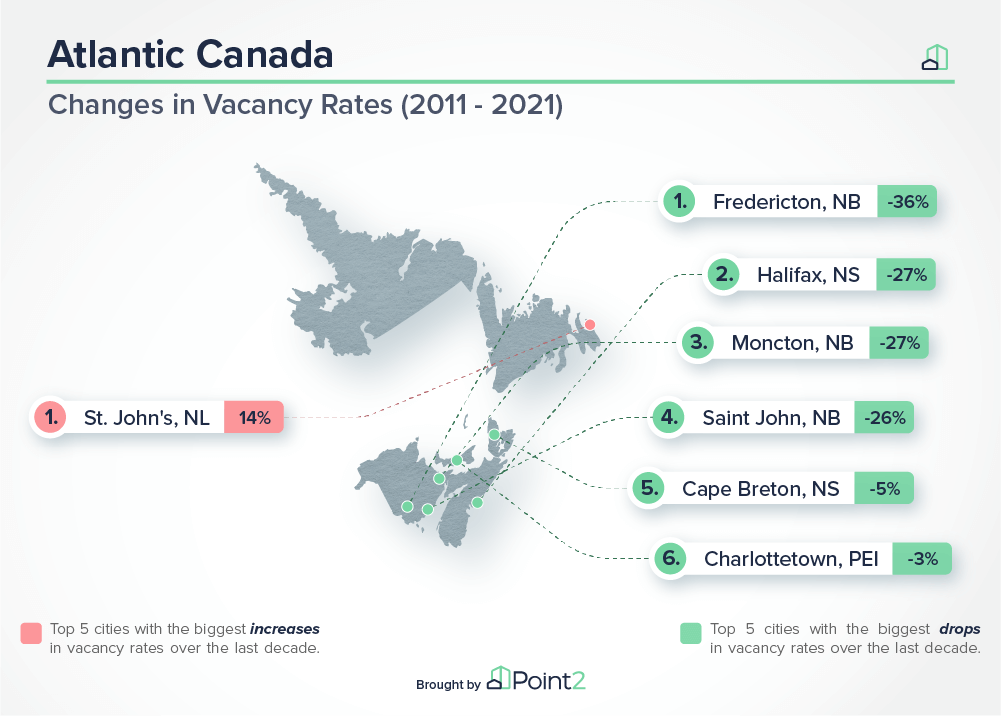 At 8.9% and 8.8%, Cape Breton, NS and St. John’s, NL had the highest vacancy rates of all of the large cities in the larger Atlantic Canada area. The lowest vacancy rate was in Fredericton, NB (4.7%).
Looking at the 10-year evolution of vacancy rates across the Maritime Provinces, the biggest drop was in Fredericton, NB: Compared to 2011, vacancy rates here fell by 36%. At the other end of the spectrum, St. John’s, NL recorded the only increase in vacancy rates of all the cities in this area: Since 2011, rates here went up 14%.
For more details and data points, scroll through the table under the map to see the full data on population changes and vacancy rates changes in the 150 most populous cities in Canada:
Methodology
- For this study, we analyzed demographic and housing data from 2011 and 2021 for Canada’s 150 largest cities.
- Population data for all 150 cities, for 2011 and 2021 was sourced from Statistics Canada.
- Housing data for all 150 cities, for 2011 and 2021 was sourced from Statistics Canada.
- The number of unoccupied homes was calculated by subtracting the number of occupied dwellings from the total number of private dwellings, both for 2011 and for 2021.
- The change in population was calculated as the number of people living in a city in 2021 divided by the number of people living in the same city in 2011.
Fair use and redistribution
We encourage and freely grant permission to reuse, host or repost this article. When doing so, we only ask that you kindly attribute the authors by linking to Point2Homes.com or this page, so that your readers can learn more about this project, the research behind it and its methodology.
For an overview of the real estate market in some of the areas mentioned in this study, visit the links below:
[columns size=”1/2″ last=”false”]
Toronto Homes for Sale
Caledon Homes for Sale
Burlington Homes for Sale
Aurora Homes for Sale
Richmond Hill Homes for Sale
Oakville Homes for Sale
London Homes for Sale
Milton Homes for Sale
Saskatoon Homes for Sale
Brandon Homes for Sale
[/columns]
Markham Homes for Sale
Langley Homes for Sale
Vaughan Homes for Sale
Cambridge Homes for Sale
Mississauga Homes for Sale
Winnipeg Homes for Sale
Burnaby Homes for Sale
Ottawa Homes for Sale
Vancouver Homes for Sale
Halifax Homes for Sale