
In 2016, there were 1.34 million empty and temporarily occupied homes in Canada. But the country’s housing problem extends beyond foreign buyers jacking up prices and unaffordability taking over major cities. Investor speculation and short-term rentals are the main culprits behind high vacancy rates in places like Toronto and Vancouver. In many other cities across the nation, decreasing populations, combined with fluctuations in local economies, are also contributing to the spike in the number of vacant homes.
In 2001, when the government first started collecting data on occupied dwellings, 7.8% of all homes in Canada were vacant. In 2006, the vacancy rate had increased to 8.4%; by 2016, it had reached 8.7%.
More than 66,000 homes are sitting empty in Toronto, ON and around 64,000 vacant homes are spread across Montréal, QC while Calgary, AB, Ottawa, ON and Edmonton, AB all have more than 20,000 vacant properties. Of Canada’s largest cities, Vancouver, BC has the highest share of empty dwellings: its 8.2% rate translates into about 25,000 vacant homes.
So, which Canadian markets have seen the most dramatic changes in vacancy rates? We analyzed demographic and housing data for Canada’s 150 largest cities in the decade between 2006 and 2016 – the most recent available data. The results revealed striking differences at the local level:
- Of Canada’s 10 largest cities, Winnipeg, MB saw the biggest jump in the number of empty homes (42.7%), followed by Montréal, QC (36.3%) and Edmonton, AB (32.5%).
- The number of empty dwellings in Vancouver, BC went up 9.6%, while the vacancy rate in Toronto, ON actually decreased by 4.7%.
- Of all the cities in the study, the most significant increases in the number of vacant dwellings were found in Grande Prairie (+181.4%), Leduc (+172.4%), and Fort Saskatchewan (+146.8%), all in Alberta.
- The biggest drops in the number of empty homes were noted in Ajax, ON (-53.1%), Burlington, ON (-52%), and Port Moody, BC (-50.4%).
- The highest vacancy rates in 2016 were in Kawartha Lakes, ON (19.%), Collingwood, ON (17.7%), and Wood Buffalo, AB (16.4%), while the lowest vacancy rates in 2016 were in Sainte-Julie, QC (1%), Orangeville, ON (1.2%) and Boucherville, QC (1.4%).
For the complete list of cities and data points, refer to the table at the end of this study and use the filters to rank cities by province or most or least significant changes in vacancy rates or population.
In BC, North Cowichan and Port Moody see largest changes in vacancy rates
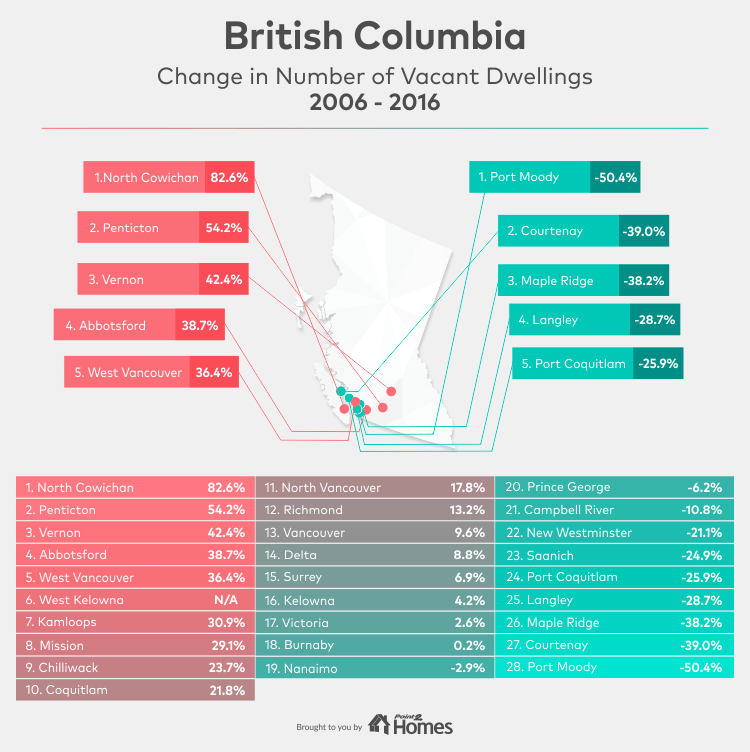
North Cowichan and Port Moody represent British Columbia’s extremes; the former experienced an 82.6% increase in vacancy rates while the latter noticed a 50.4% decrease.
Although populations have increased in all cities in BC, vacancy rates decreased in only 10 of the 28 cities included in the study. In a sign that policymakers are starting to view this phenomenon as a red flag, the Vancouver City Council approved a tax on empty homes.
Beginning in 2018, those who own homes that do not serve as their main residences, or that aren’t rented for at least six months of the year, have to pay the equivalent of 1% of the home’s value. Gregor Robertson, former mayor of Vancouver, said the tax was aimed at owners who view real estate as an investment opportunity:
Vancouver has been in this crisis for over a decade […] We had ramped up our rental housing supply, [and] focused on supportive housing for our most vulnerable population, but the pressure in the real estate market continued to escalate dramatically. The influx of foreign capital wasn’t well regulated by our federal government. The result was untethered speculation, jacked-up prices and flipping in the local real estate market.
The tax was expected to bring in around $38 million last year alone, but officials are not sure if its main goal – to encourage owners to rent out empty homes – was accomplished.
Overall, the highest vacancy rate in 2016 lands in West Vancouver, where 9.2% of total dwellings are vacant, up from 6.7% in 2006. Vancouver, follows suit, with an 8.2% vacancy rate, up from 7.5% in 2006.
The Prairies: 3 cities in Alberta have highest spikes in vacancy rates in Canada
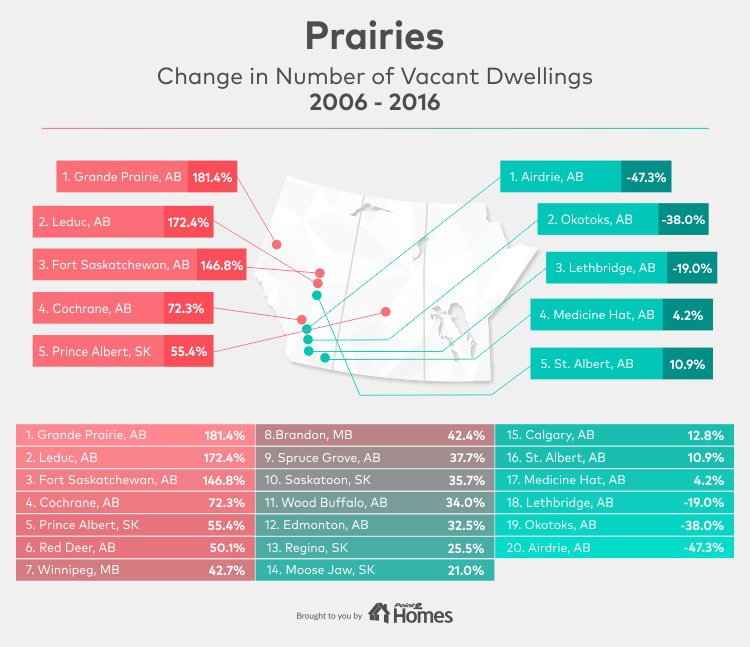
Alberta is home to the only three cities where the number of vacant homes more than doubled between 2006 and 2016: Grande Prairie, AB; Leduc, AB; and Fort Saskatchewan, AB, saw the biggest increases in the share of empty homes in the country. This jump in the number of vacant properties – and especially newly built vacant properties across Alberta – is mostly due to the uncertain economy and harsher labour market conditions. Additionally, higher mortgage rates and tougher mortgage financing rules were also influential, although to a smaller degree.
The cities with the highest vacancy rates in 2016 were Wood Buffalo, AB (16.5%), Grande Prairie, AB (9.6%), and Prince Albert, SK (8.7%). At the other end of the spectrum, the cities with the lowest vacancy rates were Okotoks, AB (1.8%), St. Albert, AB (2%), and Airdrie, AB (3.3%).
Historical trends demonstrate that homebuyers no longer feel confident enough to buy, but the current situation is proof of this, as well. According to ATB Financial, the number of vacant new homes in Edmonton, AB reached a record high, with 1,941 homes completed but not sold; in Calgary, AB, that number reached 891 in January. Moreover, concerns about a new, possibly milder recession that might hit the province again only add fuel to the fire that is housing and homeownership.
Baie-Comeau and Saint-Georges note biggest changes in Quebec
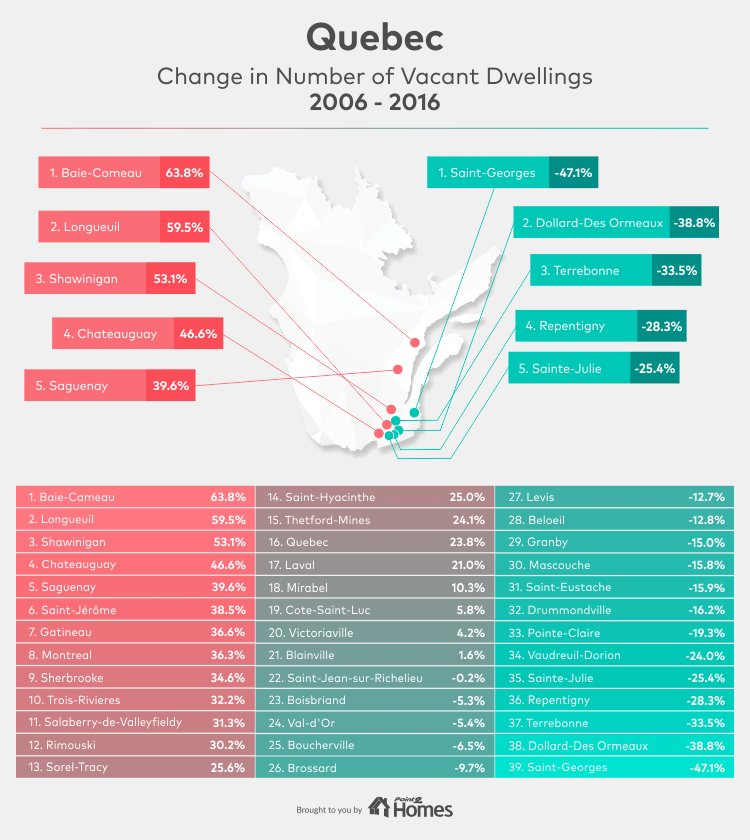
In Baie-Comeau, the vacancy rate reached 5.4% after a 63.8% increase, while in Saint-Georges the rate went from 5.4% to 2.9%, representing a 47.1% drop.
In 2016, the cities with the highest percentage of empty homes in the province were Shawinigan, Sherbrooke, and Montréal. Conversely, the following all had vacancy rates less than 2%, which signals better occupancy:
- Beloeil
- Blainville
- Boucherville
- Repentigny
- Sainte-Julie
- Terrebonne
The most significant spikes in population were in Vaudreuil-Dorion (a 47.8% increase between 2006 and 2016) and Mirabel (45.9%). Across the province, the population of three cities decreased from 2006 to 2016: Shawinigan (-4.9%), Baie-Comeau (-4.5%), and Thetford-Mines (-1.2%).
Québec posts the lowest homeownership rates in Canada, and the cities in the province have always leaned towards renting rather than buying. And this particularity of the province doesn’t show any signs of changing, especially in Montréal. Although almost half of its households are renters, there is also a staggering number of vacant dwellings in the city, as well: in 2016, over 64,000 homes were empty. According to the latest report from the Canada Mortgage and Housing Corporation:
The number of properties for sale on the resale market has been steadily declining for three years in Greater Montreal. The current strong market, where newly listed properties sell the first time rather than being relisted for sale more than once a year, is one cause. The low level of single-family home and condominium construction in recent years is another. Lastly, significantly fewer developers are engaging real estate brokers to sell their new condominiums.
14 Ontario cities experience significant drops in vacancy rates
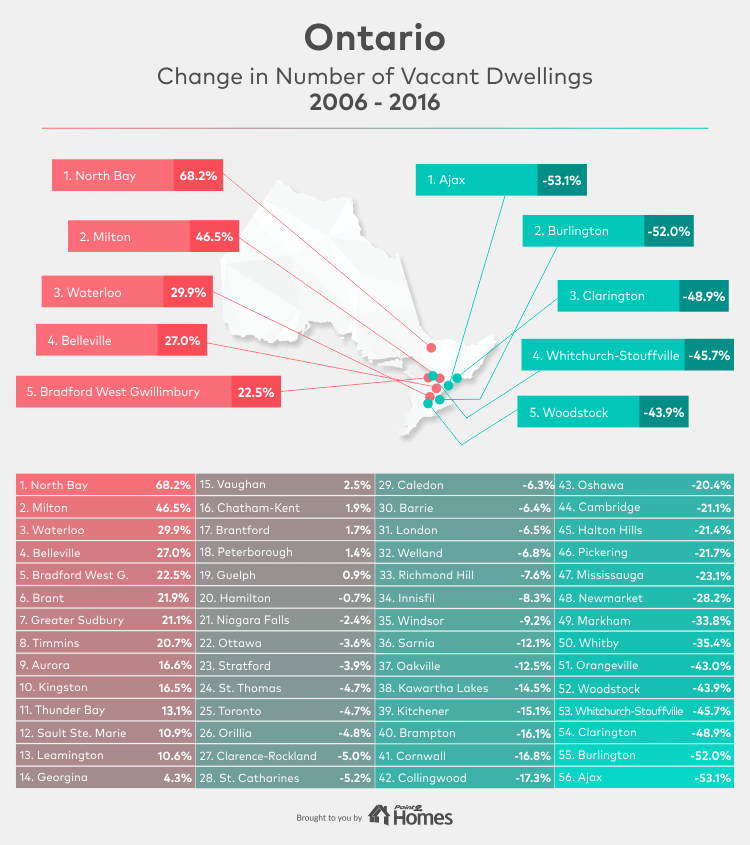
Of the 56 largest cities in Ontario, 16 had reached a vacancy rate of less than 3% as of 2016. At the other end of the spectrum, five cities have vacancy rates above 10%; in Kawartha Lakes, almost 20% of all private dwellings are unoccupied. When it comes to the most significant changes in the number of empty homes in the province, North Bay and Milton lead the way with the biggest increases, while Ajax and Burlington both decreased the number of empty homes by more than 50%.
The cities with the most impressive increases in population were Milton (104.2%) and Whitchurch-Stouffville (87.9%). Contrarily, the most significant drops in population were in Chatham-Kent (-6%), North Bay (-4.5%), and Leamington (-4.3%).
According to hydro data, which estimates the number of empty dwellings by analyzing water consumption, 15,000 to 28,000 homes are sitting empty in Toronto. Ana Bailao, Toronto city councillor, said this was approximately the same as the number of new units that come to market in a year, so unlocking the potential of these dwellings was of the city’s major goals. Consequently, and following in the steps of Vancouver, BC, the Toronto City Council is considering implementing its own empty home tax.
All of Atlantic Canada’s largest cities have vacancy rates greater than 5%
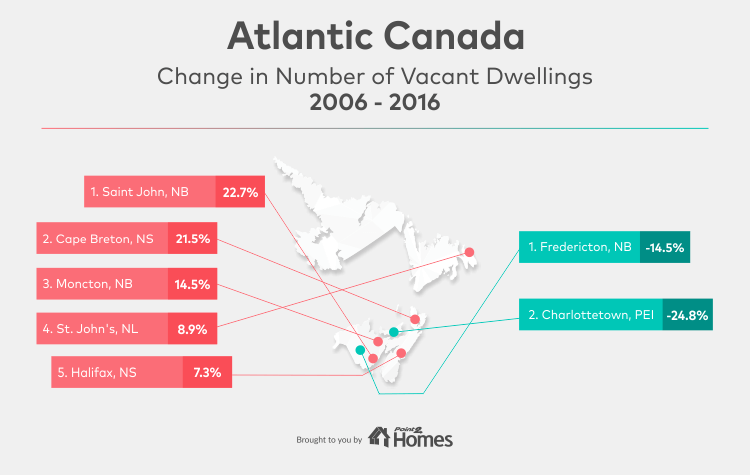
Saint John, NB and Charlottetown, PEI have seen the biggest changes in vacancy rates in 10 years, with a 22.7% increase and a 24.8% decrease, respectively.
Fredericton, NB had a 15.2% increase in population, and also the second-biggest drop in vacancy rates (-14.5%).
Considering what the future has in store for the Maritime Provinces, along with Newfoundland and Labrador, CMHC’s report states:
All else being equal, multi-residential housing completions in Atlantic Canada’s urban centres are forecast to decline over the next 20 years. This expected decline for apartments, semi-detached and row housing follows the slowing pace of household formation from the last five years (2012-2016). […] Multiples activity over the next 10 years could decline from 3,373 completions per year (between) 2012-2016 to between 1,590 and 3,085 completions per year over the period 2017-2021 and 650 to 1,620 completions per year for the period 2022-2026.
What the future holds
Although 2006 to 2016 saw profound changes and fluctuations in vacancy rates at the local level, both current analyses and future market prospects point to more balanced conditions overall. According to Canada Mortgage and Housing Corporation’s 2018 Housing Market Outlook,
Housing starts are forecast to slow down gradually over the 2018 to 2020 forecast horizon, moderating from the 10-year high recorded in 2017 to levels more in line with a moderating economic outlook and demographic conditions.
Moderation seems to be the name of the game, with housing stocks getting in line with population changes and economic conditions in all major regions across the country.
Article last updated December, 2021.
Methodology
- For this study, we analyzed demographic and housing data for Canada’s 150 largest cities, from 2006 and 2016.
- Population data for all 150 cities, for 2006 and 2016 was sourced from Statistics Canada.
- Housing data for all 150 cities, for 2006 and 2016 was sourced from Statistics Canada.
- The number of vacant homes is calculated by subtracting the number of occupied homes from the total number of private dwellings, both for 2006 and for 2016.
- The change in population is calculated as the number of people living in a city in 2006 divided by the number of people living in the same city in 2016.
Fair use and redistribution
We encourage and freely grant permission to reuse, host or repost this article. When doing so, we only ask that you kindly attribute the authors by linking to Point2Homes.com or this page, so that your readers can learn more about this project, the research behind it and its methodology.