Cincinnati, OH Homes for Sale & Real Estate
2,259 Homes for Sale in Cincinnati, OH
-
25
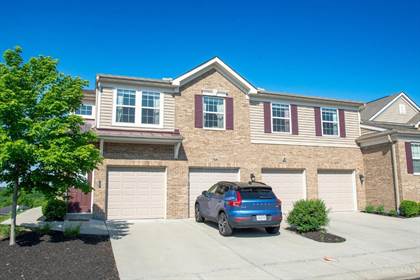
- 2 BedsBds
- 2 BathsBa
- 1,360 SqftSqft
- 0.053 ac Lot Size
- Residential
Open House -
55
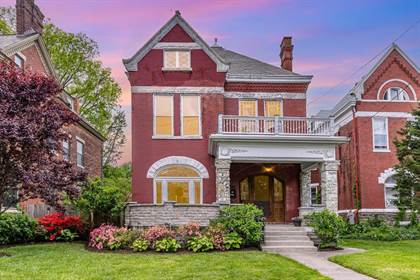
- 4 BedsBds
- 4 BathsBa
- 2,608 SqftSqft
- 0.082 ac Lot Size
- Residential
Open House -
48
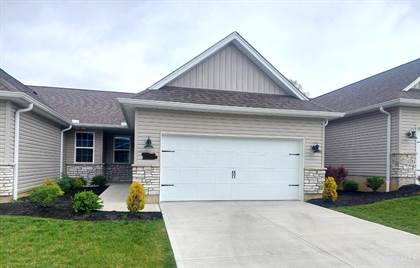
- 4 BedsBds
- 3 BathsBa
- 1,970 SqftSqft
- 0.202 ac Lot Size
- Residential
-
37
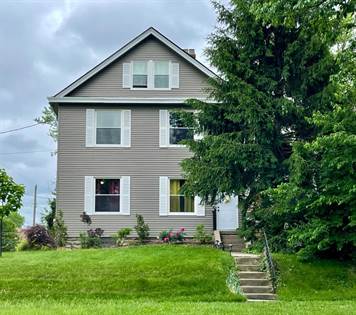
- 3 BedsBds
- 2 BathsBa
- 1,212 SqftSqft
- 0.145 ac Lot Size
- Residential
Open House -
40
- 4 BedsBds
- 4 BathsBa
- 2,772 SqftSqft
- 0.225 ac Lot Size
- Residential
Open House -
37
- 3 BedsBds
- 3 BathsBa
- 1,472 SqftSqft
- 0.189 ac Lot Size
- Residential
Open House -
-
32
- 4 BedsBds
- 5 BathsBa
- 4,618 SqftSqft
- 0.688 ac Lot Size
- Residential
Open House -
23
- 3 BedsBds
- 2 BathsBa
- 1,446 SqftSqft
- 0.077 ac Lot Size
- Residential
-
50
- 3 BedsBds
- 3 BathsBa
- 4,106 SqftSqft
- 0.371 ac Lot Size
- Residential
Open House -
62
- 3 BedsBds
- 4 BathsBa
- 1,910 SqftSqft
- Residential
-
36
- 3 BedsBds
- 3 BathsBa
- 2,753 SqftSqft
- 0.201 ac Lot Size
- Residential
Open House -
37
- 4 BedsBds
- 1 BathBa
- 1,728 SqftSqft
- 0.145 ac Lot Size
- Residential
-
34

- 2 BedsBds
- 2 BathsBa
- 1,146 SqftSqft
- 0.62 ac Lot Size
- Residential
Open House -
34
- 2 BedsBds
- 2 BathsBa
- 1,146 SqftSqft
- 0.62 ac Lot Size
- Residential
-
32
- 2 BedsBds
- 1 BathBa
- 1,008 SqftSqft
- 0.032 ac Lot Size
- Residential
Open House -
36
- 2 BedsBds
- 2 BathsBa
- Residential
Open House -
26
- 3 BedsBds
- 3 BathsBa
- 2,517 SqftSqft
- 1.113 ac Lot Size
- Residential
Open House -
23
- 2 BedsBds
- 2 BathsBa
- 953 SqftSqft
- 1.416 ac Lot Size
- Residential
-
41
- 4 BedsBds
- 3 BathsBa
- 3,667 SqftSqft
- 0.173 ac Lot Size
- Residential
Open House -
24
- 2 BedsBds
- 2 BathsBa
- 1,325 SqftSqft
- Residential
Open House -
22
- 4 BedsBds
- 3 BathsBa
- 2,557 SqftSqft
- 0.12 ac Lot Size
- Residential
-
22
- 3 BedsBds
- 2 BathsBa
- 1,788 SqftSqft
- 0.173 ac Lot Size
- Residential
-
14
- 3 BedsBds
- 1 BathBa
- 962 SqftSqft
- Residential
-
32
- 4 BedsBds
- 4 BathsBa
- 2,805 SqftSqft
- 0.491 ac Lot Size
- Residential
1 - 24 of 2,259 Results
Best Schools in Cincinnati
| School Name | GreatSchools Rating | Grades | Students |
|---|---|---|---|
|
Spencer Academy
Elementary & Middle School
3-9
312
|
3-9 | 312 | |
|
Hilltop Elementary School
Elementary School
K-4
285
|
K-4 | 285 | |
|
Springdale Elementary School
Elementary School
PK, K-5
439
|
PK, K-5 | 439 | |
|
Indian Hill Elementary School
Elementary School
3-5
464
|
3-5 | 464 | |
|
Summit Elementary School
Elementary School
PK, K-6
620
|
PK, K-6 | 620 | |
|
Madeira Elementary School
Elementary School
K-4
628
|
K-4 | 628 | |
|
Elm Avenue Elementary School
Elementary School
K-4
226
|
K-4 | 226 | |
|
Mariemont Elementary School
Elementary School
K-6
563
|
K-6 | 563 | |
|
Madeira Middle School
Elementary & Middle School
5-8
485
|
5-8 | 485 | |
|
Wilson Elementary School
Elementary School
K-6
709
|
K-6 | 709 |
| School Name | GreatSchools Rating | Grades | Students |
|---|---|---|---|
|
Sycamore High School
Middle & High School
8-12
1675
|
8-12 | 1675 | |
|
Sycamore Junior High School
Middle School
7-8
809
|
7-8 | 809 | |
|
Walnut Hills High School
Middle & High School
7-12
2976
|
7-12 | 2976 | |
|
Spencer Academy
Elementary & Middle School
3-9
312
|
3-9 | 312 | |
|
Mariemont Junior High School
Middle School
7-8
293
|
7-8 | 293 | |
|
Madeira High School
Middle & High School
8-12
403
|
8-12 | 403 | |
|
Madeira Middle School
Elementary & Middle School
5-8
485
|
5-8 | 485 | |
|
Indian Hill Middle School
Middle School
6-8
512
|
6-8 | 512 | |
|
Wyoming Middle School
Elementary & Middle School
5-8
623
|
5-8 | 623 | |
|
T.C.P. World Academy
Elementary & Middle School
K-7
513
|
K-7 | 513 |
| School Name | GreatSchools Rating | Grades | Students |
|---|---|---|---|
|
Sycamore High School
Middle & High School
8-12
1675
|
8-12 | 1675 | |
|
Turpin High School
High School
9-12
1116
|
9-12 | 1116 | |
|
Walnut Hills High School
Middle & High School
7-12
2976
|
7-12 | 2976 | |
|
Mariemont High School
High School
9-12
498
|
9-12 | 498 | |
|
Wyoming High School
High School
9-12
658
|
9-12 | 658 | |
|
Anderson High School
High School
9-12
1262
|
9-12 | 1262 | |
|
Indian Hill High School
High School
9-12
639
|
9-12 | 639 | |
|
Madeira High School
Middle & High School
8-12
403
|
8-12 | 403 | |
|
School For Creat & Perf Arts High School
Elementary, Middle & High School
K-12
1336
|
K-12 | 1336 | |
|
Princeton High School
High School
9-12
1572
|
9-12 | 1572 |
Data provided by GreatSchools i
Cincinnati, OH Real Estate Market Status
Median Listing Price
$250,000
Median Listing Price per Sqft
$162 /sqft
Median Living Area
1,602 sqft
Total Homes for Sale
2,013
Disclaimer
The statistics in this graph were aggregated using active listing inventories on Point2. Since there can be technical lags in the updating processes, we cannot guarantee the timeliness and accuracy of this information.
Cincinnati, OH Home Sales Price Trends
/
| Year | Q1 | Q2 | Q3 | Q4 |
|---|---|---|---|---|
| 2021 | $169,000 | $193,000 | $198,000 | $189,900 |
| 2022 | $187,500 | $217,500 | $215,000 | $200,000 |
| 2023 | $187,500 | $230,000 | $230,000 | $210,000 |
/
| Year | Q1 | Q2 | Q3 | Q4 |
|---|---|---|---|---|
| 2021 | 3,653 | 3,904 | 4,453 | 3,978 |
| 2022 | 3,147 | 3,650 | 3,690 | 2,964 |
| 2023 | 2,190 | 2,932 | 2,990 | 828 |
/
| Year | Q1 | Q2 | Q3 | Q4 |
|---|---|---|---|---|
| 2021 | $121 | $135 | $140 | $135 |
| 2022 | $136 | $154 | $153 | $143 |
| 2023 | $140 | $164 | $162 | $151 |
/
| Year | Q1 | Q2 | Q3 | Q4 |
|---|---|---|---|---|
| 2021 | $171,000 | $195,000 | $200,000 | $192,500 |
| 2022 | $189,900 | $220,000 | $215,000 | $203,000 |
| 2023 | $190,500 | $233,500 | $233,000 | $215,000 |
Disclaimer
The statistics in this graph were aggregated using the latest PropertyShark data available. The information is deemed reliable but not guaranteed.
Popular Neighborhoods
- Pleasant Ridge Homes for Sale
- Hyde Park Homes for Sale
- Northside Cincinnati Homes for Sale
- Oakley Homes for Sale
- Columbia Tusculum Homes for Sale
- College Hill Homes for Sale
- Madisonville Homes for Sale
- North Avondale Homes for Sale
- East Walnut Hills Homes for Sale
- Westwood Homes for Sale
- Clifton Homes for Sale
- Sayler Park Homes for Sale
- Walnut Hills Homes for Sale
- Downtown Cincinnati Homes for Sale
- California Homes for Sale
- Pendleton Homes for Sale
- Riverside Homes for Sale
- Roselawn Homes for Sale
- Hartwell Homes for Sale
- Carthage Homes for Sale
- East Price Hill Homes for Sale
Nearby Cities
- West Chester Homes for Sale
- Dayton Homes for Sale
- Kettering Homes for Sale
- Marion Homes for Sale
- Mason Homes for Sale
- Fairfield Homes for Sale
- Beavercreek Homes for Sale
- Centerville Homes for Sale
- Lebanon Homes for Sale
- Loveland Homes for Sale
- Middletown Homes for Sale
- Hamilton Homes for Sale
- Hamilton Homes for Sale
- Salem Homes for Sale
- Salem Homes for Sale
- Xenia Homes for Sale
- Springboro Homes for Sale
- Madison Homes for Sale
- Miamisburg Homes for Sale
- Brookville Homes for Sale
- Milford Homes for Sale
Looking for storage units?
Check out available storage units in Cincinnati, OH, on our sister website, StorageCafe!